. 2022 Jan 24;11:e69094. doi: 10.7554/eLife.69094

Figure 3. 2P and 3P structural imaging of the fly brain.

(A) Cross-section images of the fly brain through the cuticle with 3P (top) and 2P (bottom) excitation at different depths. The third harmonic generation (THG) images are included at the bottom. 3P excitation power is <11 mW and the repetition rate is 333 kHz. 2P excitation power is <15 mW and the repetition rate is 80 MHz, scale bars = 50 µm. (B) GFP signal as a function of depth for 920 nm 2P excitation and 1320 nm 3P excitation. (C) Comparison of the GFP signal and THG signal as a function of depth at 1320 nm. (D) Lateral resolution measurement in the THG image captured at 200 µm depth. Lateral intensity profile measured along the white line (indicated by the orange arrow) is fitted by a Gaussian profile for the lateral resolution estimation (scale bar = 50 µm). (E) Cross-section images of the central complex (CC) ring neurons through the cuticle with 1320 nm 3P excitation (green). THG imaging visualizes the tracheal arbors (yellow). Arrows indicate different CC compartments that are identified (scale bars = 30 µm). (F–G) Lateral resolution measurements in 3P images captured at 56 µm depth. (F) The GFP fluorescence profile of CC ring neurons (green) and (G) the THG profile of surrounding trachea (yellow). Lateral intensity profiles measured along the white lines are fitted by Gaussian profiles for the lateral resolution estimation (scale bars = 20 µm).

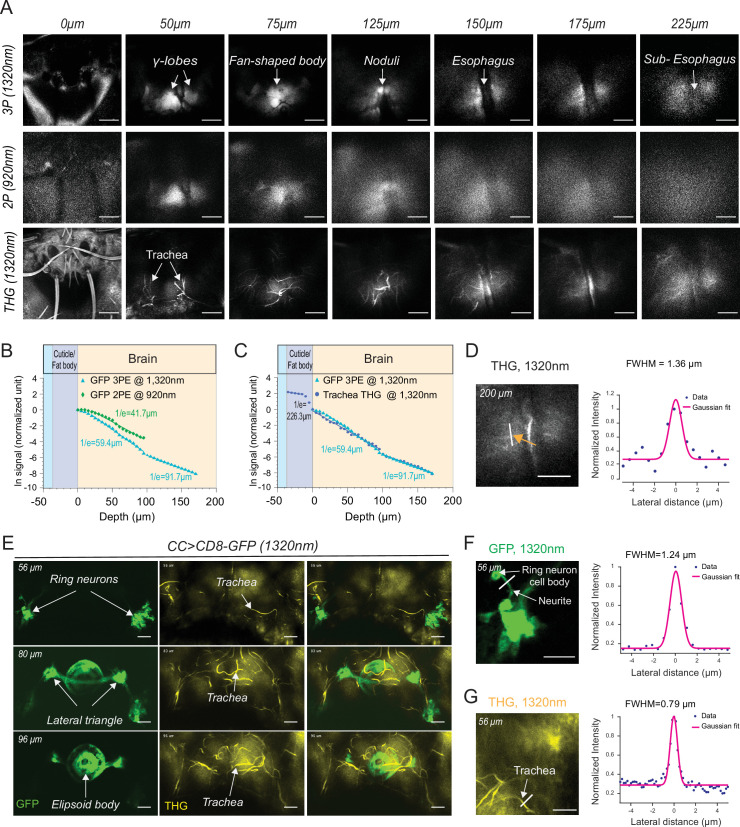
Figure 3—source data 1. Source data for plots Figure 3B and C.

Figure 3.

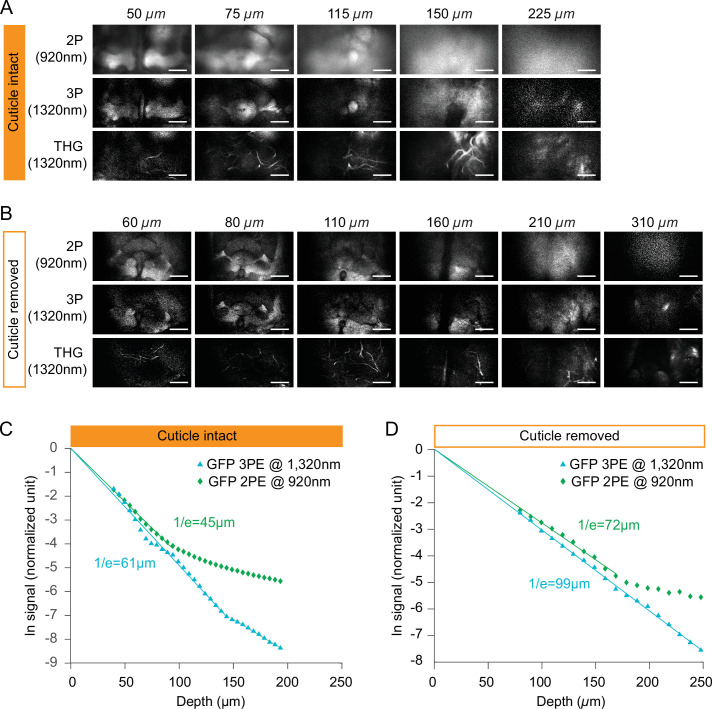
Figure 3—figure supplement 1. Comparing fluorescent signal attenuation with 2P and 3P excitation in cuticle-intact and cuticle-removed imaging preparations.

Figure 3—figure supplement 1.

(A–B) Structural cross-section images through (A) a cuticle-intact imaging preparation and (B) a cuticle-removed preparation 2P fluorescence (top), 3P fluorescence (middle), and third harmonic generation (bottom). Flies expressing membrane-targeted GFP pan neuronally is used in all experiments. The excitation power for 3P imaging is <15 mW, and the repetition rate is 333 kHz. The excitation power for 2P imaging is <15 mW, and the repetition rate is 80 MHz. Scale bars = 50 µm. (C–D) Normalized signal attenuation with 920 nm 2P and 1320 nm 3P excitation in a cuticle-intact (C) and a cuticle-removed (D) fly brain.
Figure 3—figure supplement 1—source data 1. Source data for plots for Figure 3—figure supplement 1C and D.
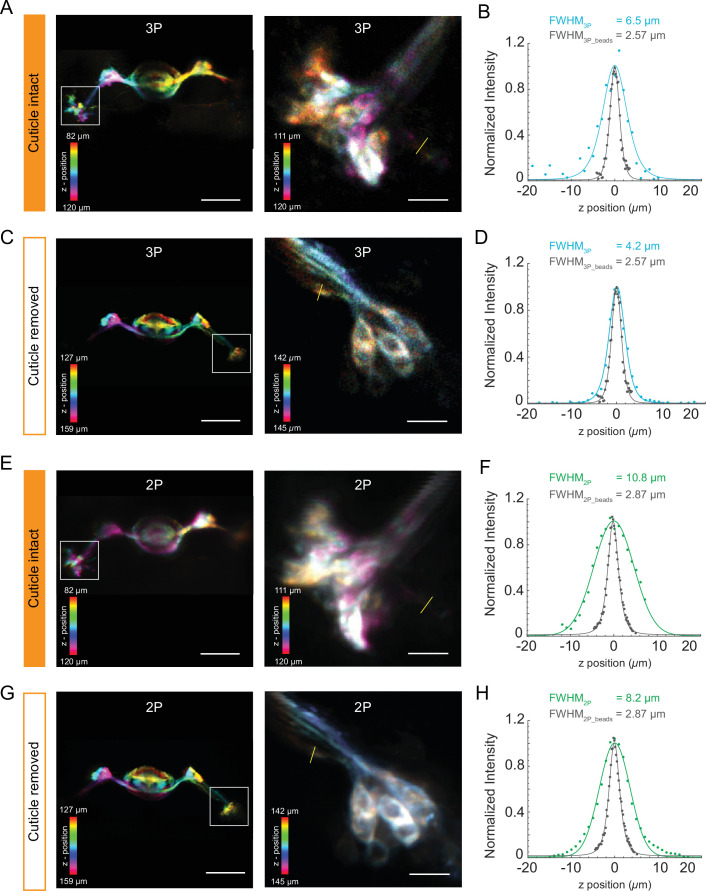
Figure 3—figure supplement 2. Structural imaging of central complex using the cuticle-intact and cuticle-removed imaging preparations.

Figure 3—figure supplement 2.

(A, C) The Z-projection images of the central complex (left, scale bar = 50 µm) and zoomed-in images of ellipsoid body ring neurons (right, scale bar = 10 µm) obtained by 3P excitation (A) through the cuticle and (C) after removing the cuticle. Measurements of the axial resolution were taken at the locations indicated by the yellow line. (B, D) Axial intensity line profile and its full width at half maximum (FWHM) are shown. (E, G) The Z-projection images of the Central complex neuropil (left, scale bar = 50 µm) and zoomed-in images of Ellipsoid body ring neurons (right, scale bar = 10 µm) obtained by 2P excitation (E) through the cuticle and (G) after removing the cuticle. Measurements of the axial resolution were taken at the locations indicated by the yellow line. (F, H) Axial intensity line profile and its FWHM is shown. The axial resolution of the 2P and 3P microscope is measured with 0.5 µm diameter fluorescent beads (shown in gray in the axial intensity line profiles). Axial intensity line profile of the location is fitted with a Lorentzian profile to the power of 2 and 3 for 2P and 3P excitation, respectively. Color bar shows the structure of the central complex at different imaging depths.
Figure 3—figure supplement 2—source data 1. Source data for plots for Figure 3—figure supplement 2B–H.
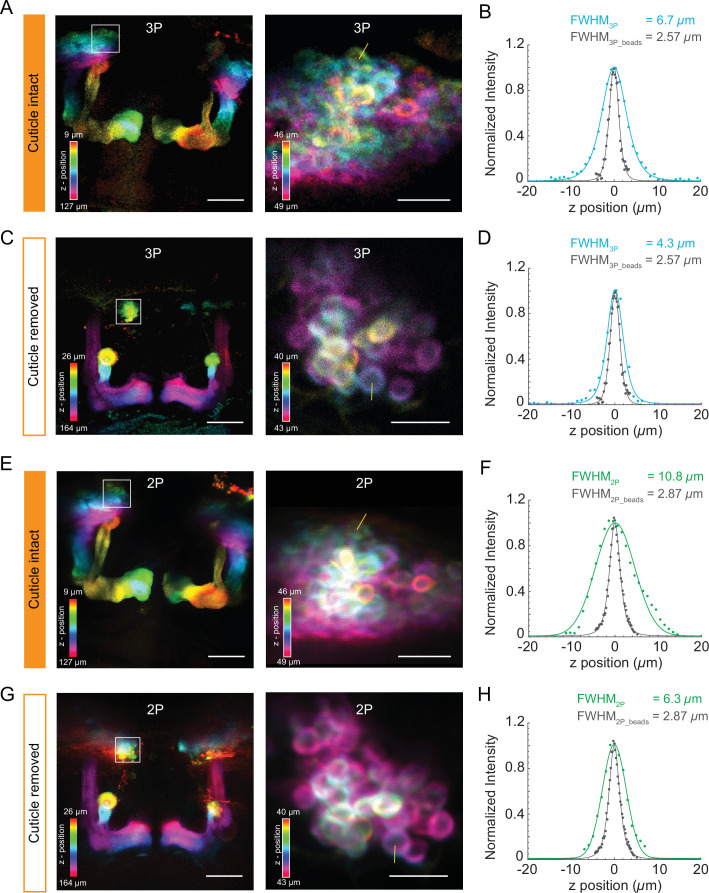
Figure 3—figure supplement 3. Structural imaging of mushroom body neurons using the cuticle-intact and cuticle-removed imaging preparations.

Figure 3—figure supplement 3.

(A, C) The Z-projection images of the mushroom body (left, scale bar = 50 µm) and zoomed-in images of Kenyon cell bodies (right, scale bar = 10 µm) obtained by 3P excitation captured (A) through the cuticle and (C) after removing the cuticle. Measurements of the axial resolution were taken at the locations indicated by the yellow line. (B, D) Axial intensity line profile and its full width at half maximum (FWHM) is shown. (E, G) The Z-projection images of the mushroom body (left, scale bar = 50 µm) and zoomed-in images of Kenyon cells (right, scale bar = 10 µm) obtained by 2P excitation captured (E) through the cuticle and (G) after removing the cuticle. Measurements of the axial resolution were taken at the locations indicated by the yellow line. (F, H) Axial intensity line profile and its FWHM is shown. The axial resolution of the 2P and 3P microscope is measured with 0.5 µm diameter fluorescent beads (shown in gray in the axial intensity line profiles). Axial intensity line profile of the location is fitted with a Lorentzian profile to the power of 2 and 3 for 2P and 3P excitation, respectively. Color bar shows the structure of the mushroom body at different imaging depths.
Figure 3—figure supplement 3—source data 1. Source data for plots for Figure 3—figure supplement 3B–H.
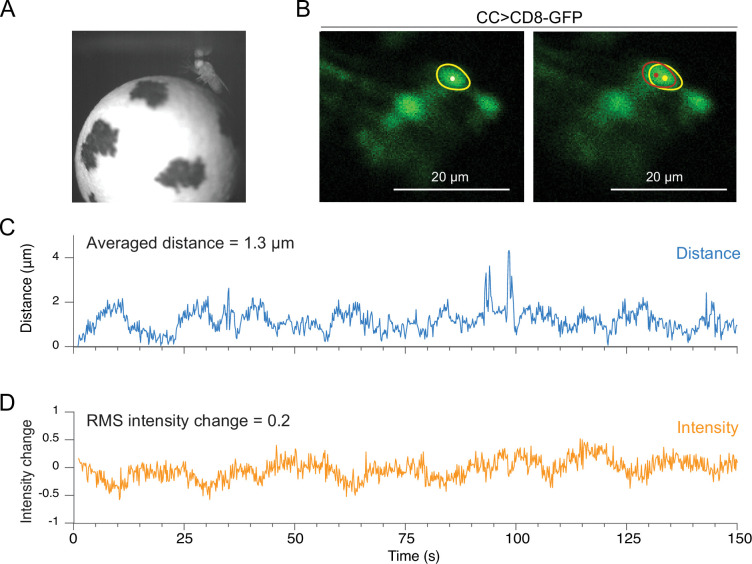
Figure 3—figure supplement 4. Motion analysis during through-cuticle imaging.

Figure 3—figure supplement 4.

(A) Imaging setup. Fly is head fixed under the microscope objective, walking on a spherical treadmill. (B) Cross-section images of ellipsoid body ring neurons (scale bar = 20 µm). A single neuron’s cell body is selected as a region of interest and used for motion measurements (yellow and red circles). (C) Absolute movement distance is shown in blue. (D) The relative intensity change of a neuron, indicated as a yellow circle, is shown in orange (RMS, root mean square).
Figure 3—figure supplement 4—source data 1. Source data for plots for Figure 4—figure supplement 1.