. 2022 Jan 24;11:e69094. doi: 10.7554/eLife.69094

Figure 5. Simultaneous 2P and 3P functional imaging of short-term odor-evoked responses of the mushroom body Kenyon cells.

(A) Schematic of the custom-made olfactometer and the through-cuticle functional imaging setup. (B) Picture of the head-fixed fly on the ball under the multiphoton microscope. (C) Stimulus timeline. The same stimulus scheme was repeated five times using the same odor. (D) Schematic of the mushroom body anatomy indicating the locations of (α, β and γ) lobes. (E) γ-Lobes have discrete anatomical compartments (shown as γ2–γ5). (F) GCaMP6s is expressed in the mushroom body Kenyon cells. Normalized (ΔF/F0) GCaMP6s signal is shown before (left) and after (right) odor stimulus (scale bar = 20 m). (G) Odor-evoked responses of Kenyon cells captured by 2P excitation at 920 nm and (H) 3P excitation at 1320 nm. (I) Comparison of the average responses captured by simultaneous 2P and 3P imaging over time (n = 3 flies, 4–5 trials per fly, data are presented as mean ± SEM in (G) and (H), gray bar indicates when stimulus is present). Average laser powers are 5 mW at 920 nm and 4 mW at 1320 nm. Images were captured at 160 × 165 pixels/frame and 13.2 Hz frame rate. 2P and 3P data were averaged to 6.8 Hz effective sampling rate for plotting.

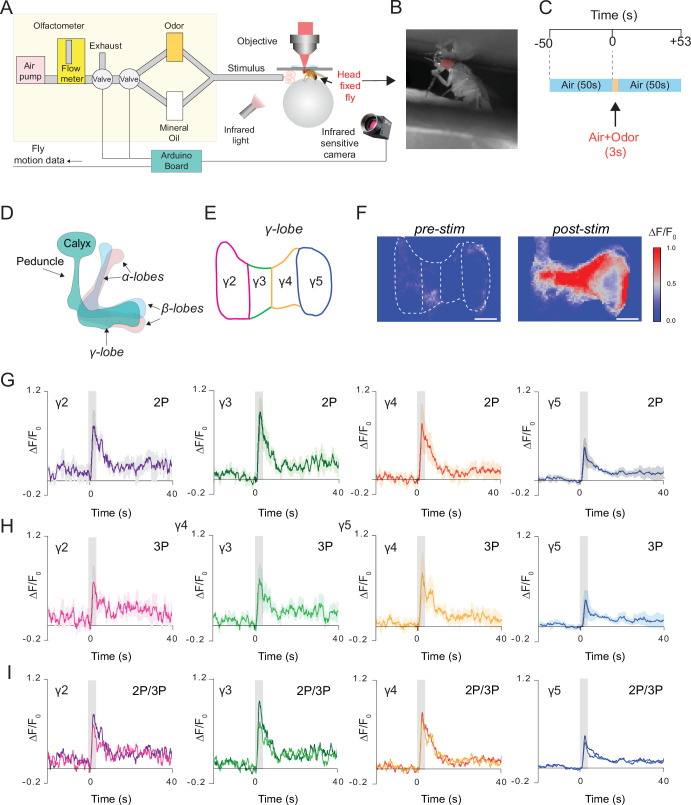
Figure 5—source data 1. Source data for plots Figure 5G-I.
elife-69094-fig5-data1.xlsx (848.9KB, xlsx)

Figure 5.

Figure 5—figure supplement 1. Single-trial neural activity traces of odor-evoked responses in the mushroom body γ5 lobes.

Figure 5—figure supplement 1.

(A) Odor-evoked responses of mushroom body γ5 lobe captured by 2P excitation at 920 nm. Normalized (ΔF/F0) GCaMP6s signal is shown for three consecutive trials. (B) Odor-evoked responses of mushroom body γ5 lobe captured by 3P excitation at 1320 nm. Normalized (ΔF/F0) GCaMP6s signal is shown for three consecutive trials. Gray bar indicates when odor stimulus is present. Images were captured at 160 × 165 pixels/frame and 13.2 Hz frame rate. 2P and 3P data were averaged to 6.8 Hz effective sampling rate for plotting.
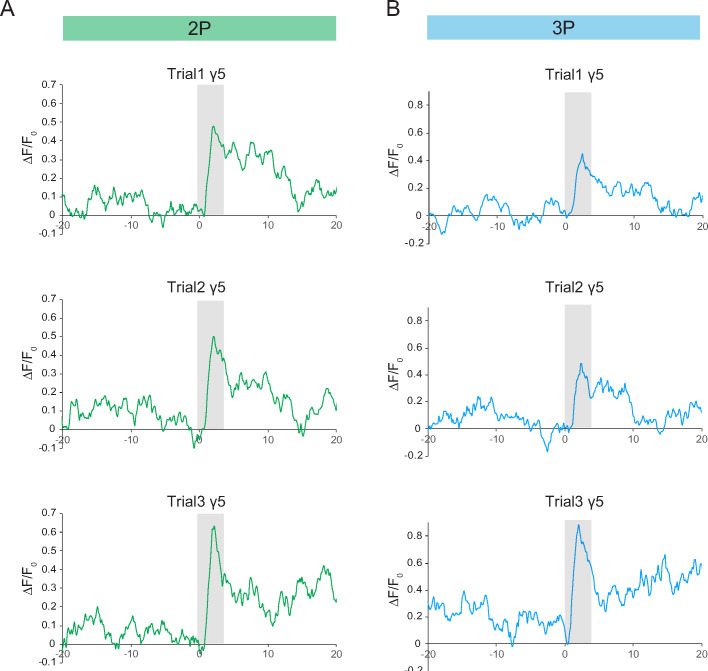
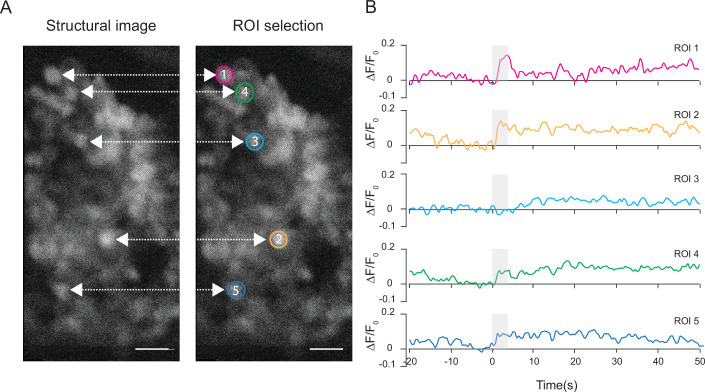
Figure 5—figure supplement 2. Neural activity traces from individual Kenyon cell bodies.

Figure 5—figure supplement 2.

(A) Structural images of the Kenyon cell bodies and region of interest (ROI) selection. (B) Quantification of the normalized ΔF/F0 signal over time in five ROIs representing five Kenyon cells imaged with 3P excitation through the intact cuticle. Gray bar indicates when the odor stimulus is present (scale bars = 10 µm). Single trial responses are shown for each ROI.