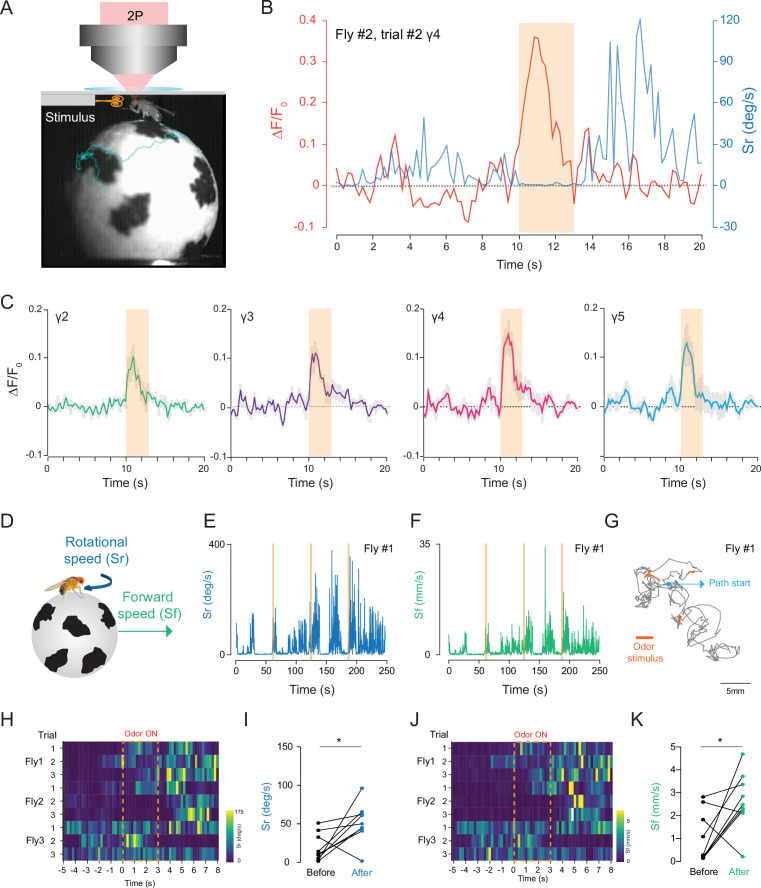
Figure 6. 2P functional imaging of odor-evoked responses in walking flies.
(A) Schematic of the custom-made odor delivery and spherical treadmill system. (B) Odor-evoked response in mushroom body four compartment is overlaid with the rotational speed (Sr) measured at the same time. (C) Normalized (ΔF/F0) GCaMP6s signal is shown during the odor stimulation experiments. Odor-evoked responses of Kenyon cells are captured by 2P excitation at 920 nm (n = 3 flies, 3 trials per fly, data are presented as mean ± SEM). (D) Schematics showing measurements of the rotational and forward speed of flies on the spherical treadmill. (E–G) Representative plots for a single fly during the odor stimulation experiments showing rotational speed (Sr) (E), forward speed (Sf) (F) as a function of time, and the total calculated 2D fictive path (G). (H–K) Summary heatmap plots and statistical comparison for rotational (H–I) and forward speed (J–K) 5 s before and after the odor stimulation (n = 3 flies, 3 trials per fly, paired-two tail t-test, p=0.0225). Average laser power at 920 nm is <10 mW. Images were captured at 256 × 128 pixels/frame and 17 Hz frame rate. 2P data were averaged to 5 Hz effective sampling rate for plotting.

