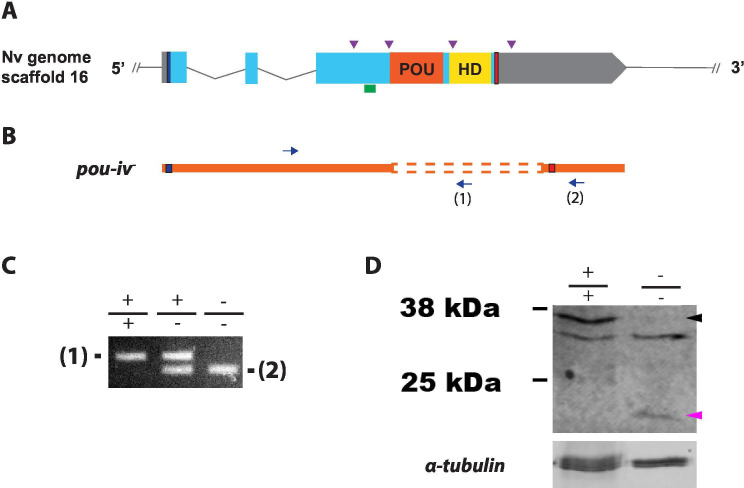
Figure 3. Generation of pou-iv null mutant sea anemones.
(A, B) Diagrams of the pou-iv locus (A) and the disrupted mutant allele (pou-iv-; B). Blue bars show predicted translation start sites; red bars show predicted translation termination sites. In A, filled boxes indicate exons, and the regions that encode the POU- and homeo-domains are highlighted in orange (‘POU’) and yellow (‘HD’), respectively. Purple arrowheads show single guide RNA (sgRNA) target sites. The region that encodes peptides targeted by the antibody generated in this study is indicated by a green line. In B, deletion mutation is boxed in dotted orange lines, and blue arrows mark regions targeted in the PCR analysis shown in C; reverse primers are numbered (1)–(2). (C) Genotyping PCR. Note that the wildtype allele-specific primer (1) generates a 689 bp PCR product from the wildtype allele ('+') but cannot bind to the pou-iv- allele due to deletion mutation. The primer (2) generates a 558 bp PCR product from the pou-iv- allele, and a 1312 bp PCR product from the wildtype allele. (D) Western blotting with an antibody against Nematostella vectensis POU-IV. An antibody against acetylated α-tubulin (‘α-tubulin’; ca. 52 kDa) was used as a loading control. The anti-POU-IV reacts with a protein of expected size for wildtype POU-IV (35.2 kDa) in wildtype (+/+) polyp extracts, but not in pou-iv mutant (-/-) polyp extracts (black arrowhead). Also note that the antibody’s reactivity with a protein of expected size for mutant POU-IV lacking DNA-binding domains (18.7 kDa) is detectable in mutant (-/-) extracts, but not in wildtype (+/+) extracts (purple arrowhead). The band just below the expected size of the wildtype POU-IV occur in both wildtype and mutant protein extracts, and therefore represents non-POU-IV protein(s) that are immunoreactive with the anti-POU-IV antibody.


