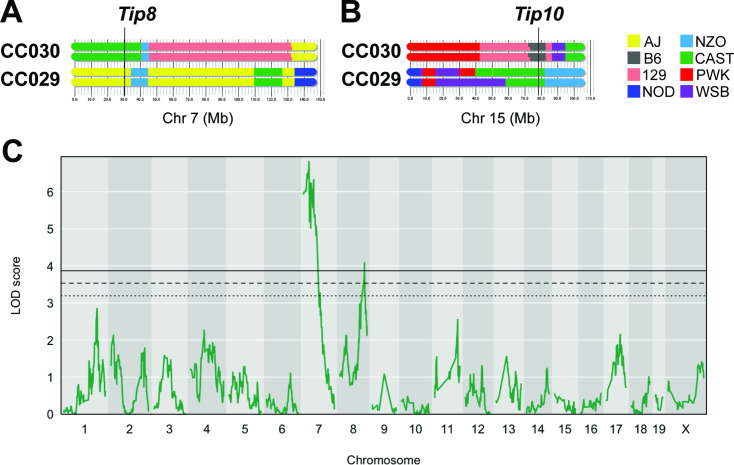
Figure 3. An F2 intercross approach to validate QTL underlying lung CFU.
(A) Haplotypes of CC030 and CC029 CC strains at Chr7 (Tip 8) and (B) at Chr15 (Tip10). The F2 population (n = 251) based on these founders were genotyped, infected with Mtb (105 infectious dose by IV route, as per the original CC screen), and lung CFU was quantified at 1 month post-infection. (C) QTL mapping identified genome-wide significant (p < 0.05) loci on Chr7 (LOD = 6.81; peak position on Chr7 at 28.6 Mb) overlapping with Tip8 and a new locus on Chr8 (LOD = 4.08; peak position Ch8:116.1 Mb). Thresholds were determined by permutation analysis; solid line, middle dashed line, and lowest dotted lines represent p = 0.05, p = 0.1, and p = 0.2. Source files of F2 genotypes are available in Figure 3—source data 1; phenotypes are available in Figure 3—source data 1.

