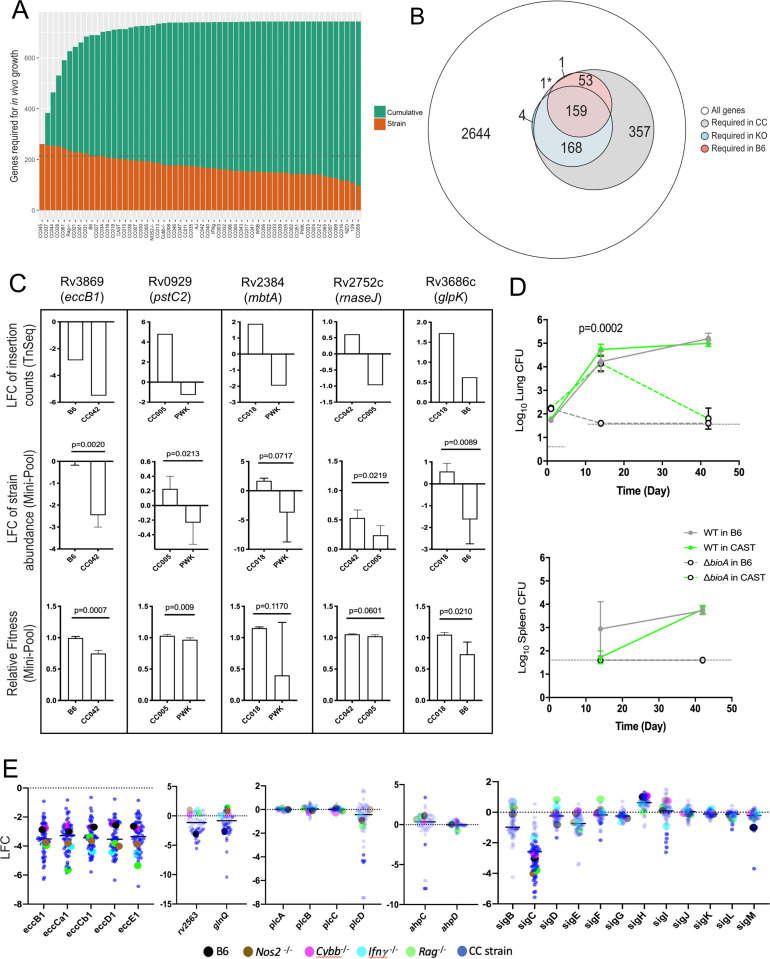
Figure 4. Mtb genetic requirements vary across diverse hosts.
(A) The number of Mtb genes required for growth or survival in each diverse mouse strain across the panel (Qval ≤0.05). Orange indicates the mutants required for each strain; turquoise shows the cumulative requirement as each new host strain is added. (B) Venn diagram showing the composition of Mtb gene sets required in each category of host (white, largest circle), only required in the CC panel (gray), required in specific immunological KO mice (blue) and genes required in B6 mice (red). Note, 1* is required in B6 and KO. In order to be called ‘essential’ in each mouse strain, Mtb genes had to be significantly over or underrepresented in at least two genotypes. (C) Each box shows log2 fold change (LFC) of individual mutants from the TnSeq screen relative to the input pool in indicated mouse strains (top); log2 fold change of the indicated deletion mutants relative to WT from a pooled mutant validation infection (middle panel); relative fitness calculated from (middle panel) to account for generation differences in each host due to differential growth rate. Bars are the average of 3–6 mice per mutant/genotype ± SD. Statistical differences between mini-pool validation groups was assessed by Welch’s t-test. (D) Lung CFU and spleen CFU from single strain low-dose aerosol infections of ∆bioA mutant or WT H37Rv strain in B6 and CAST mice at 2- or 5 weeks post-infection. Dashed line indicates the limit of detection. Each point indicates the average CFU ± SD of 4–5 mice per group. Statistical differences between groups were assessed by mixed effects models (Tukey’s test). (E) Log2 fold change of selected mutants from the TnSeq screen across the CC panel and immunological KO mice. Each dot represents the average LFC per mouse genotype; KO mouse strains (on a B6 background) dots are shown larger for clarity. All mice in the large CC TnSeq screen were male; mice in the ∆bioA aerosol validation were female; mice in the mini-pool validation studies were male and female with no significant differences detected. Source file of the TnSeq screen is available in Figure 4—source data 1; source count data of the TnSeq validation experiment is available in Figure 4—source data 2.
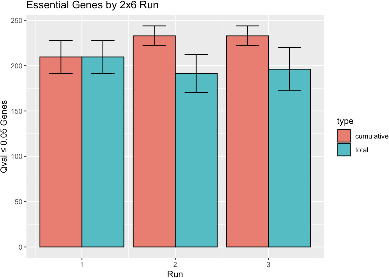
Figure 4—figure supplement 1. Sampling additional B6 libraries does not appreciably increase the estimate of genes necessary for growth.


