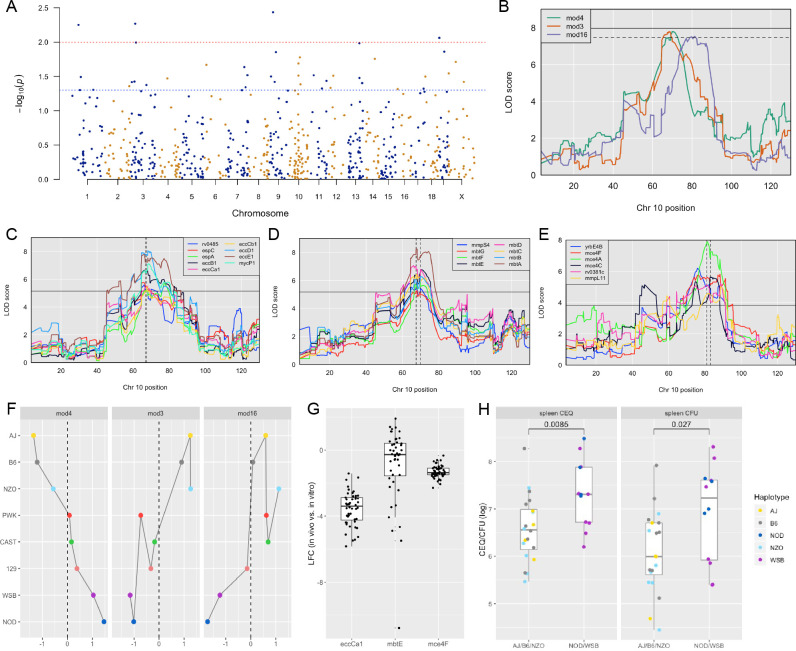
Figure 6. Identification of ‘Host Interacting with Pathogen’ QTL mapping (HipQTL).
(A) Manhattan plot of single Mtb mutant QTL mapping across the mouse genome. Each dot represents an individual Mtb mutant plotted at the chromosomal location of its maximum LOD score. Red dashed line indicates p < 0.01; Blue p < 0.05. (B) Chromosome 10 QTL (in Mb) corresponding to Mtb eigentraits identified in network analysis in Figure 5. Module 3 (Type VII secretion, ESX1 operon; orange), Module 4 (Mycobactin synthesis, mbt; green) and Module 16 (Cholesterol uptake, mce4; purple) are shown. Solid and dotted lines indicated p = 0.05 and p = 0.1, respectively. Chromosomal position is in megabase units (Mb). (C–E) QTL mapping of single Mtb mutants corresponding to the (C) ESX1 module, (D) mbt module and (E) mce4 modules. Coincidence of multiple QTL was assessed by the NL-method of Neto et al., 2012. Thresholds shown are for N = 9, N = 8, and N = 6 for panels C, D, and E, respectively. Chromosomal position is in megabase units (Mb). (F) Parental founder effects underlying Module 3, 4, and 16 QTL. Allele effects were calculated at the peak LOD score marker on chromosome 10. (G) Distribution of log2 fold change (LFC) of representative single mutants from each module; eccCa1 (ESX1 module), mbtE (mbt module), and mce4F (mce4 module) relative to in vitro. Each dot is the LFC of the specified mutant in each CC mouse strain. Box and whiskers plots of each trait indicate the median and interquartile range. (H) Spleen CEQ and Spleen CFU for CC strains (box plots as in G). Mouse values are grouped by the parental haplotype allele series underlying the chromosome 10 Hip42 locus (NOD/WSB vs AJ/B6/NZO). Each dot represents the average CFU/CEQ of each CC genotype. Statistical differences in disease-associated traits and distinct haplotypes groups were assessed by t-test. LOD, logarithm of the odds; LFC, log2 fold change; CEQ, chromosomal equivalents; CFU, colony-forming units.

