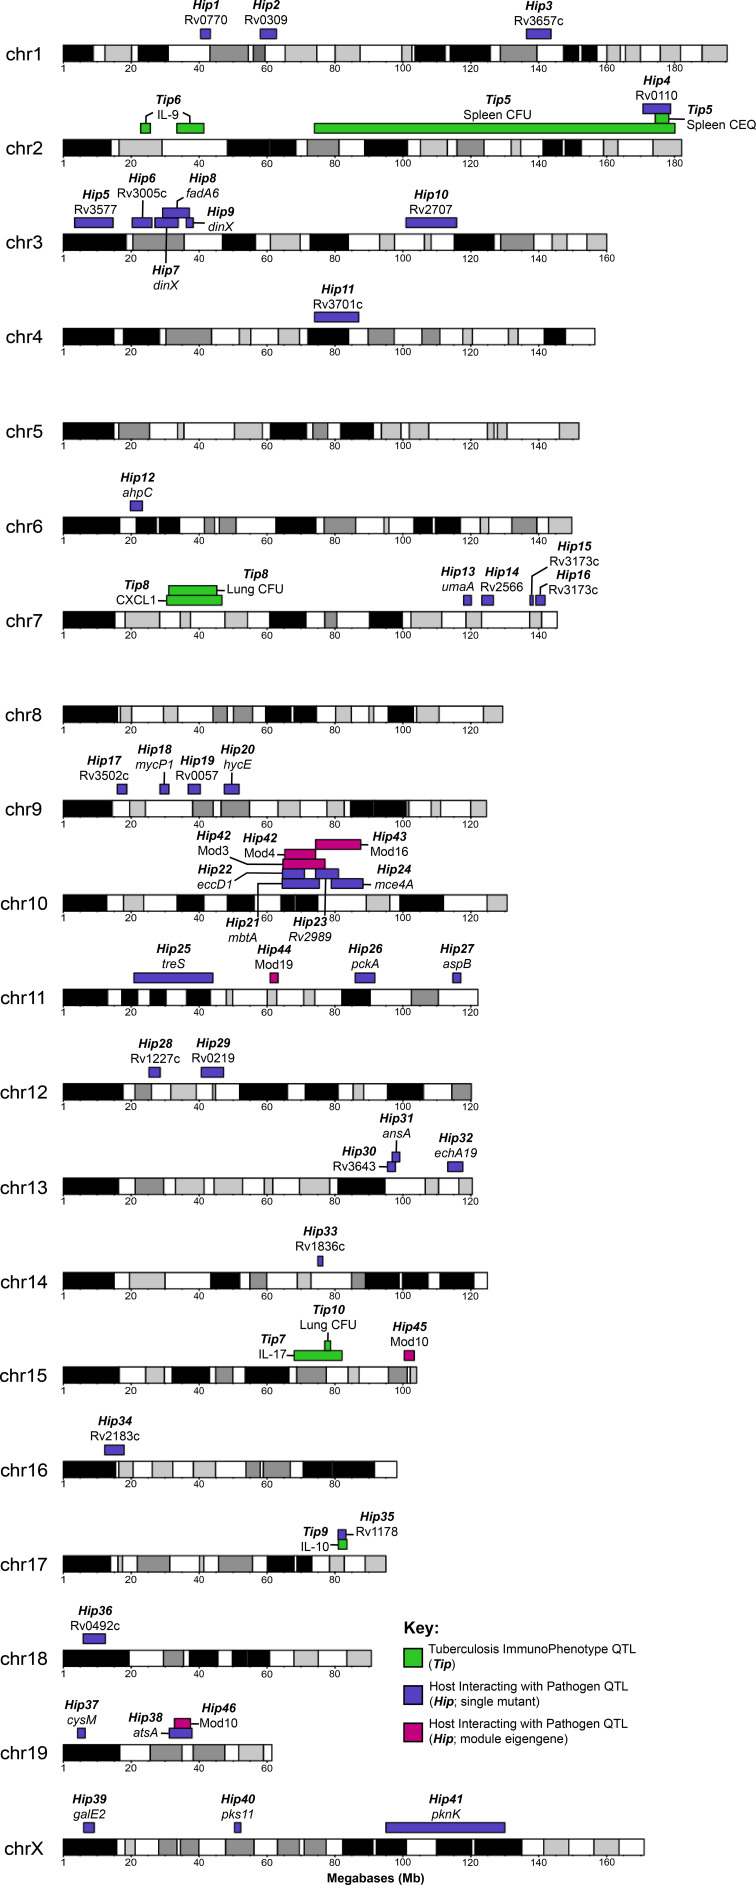
Figure 7. Visual representation of all Tip and HipQTL mapped in the CC TnSeq infection screen.
Tuberculosis ImmunoPhenotypes (Tip) QTL (QTL mapped by disease-associated traits in CC mice), are shown in green. TipQTL mapped by separate traits that share similar founder effects were considered to be the same QTL and were named accordingly. Host Interacting with Pathogen (Hip) QTL, (QTL mapped by individual TnSeq mutant relative abundance profiles), are shown in purple. After WGCNA mutant clustering and mapping with representative eigengenes from each module, QTL mapped by module eigengenes are shown in magenta.

