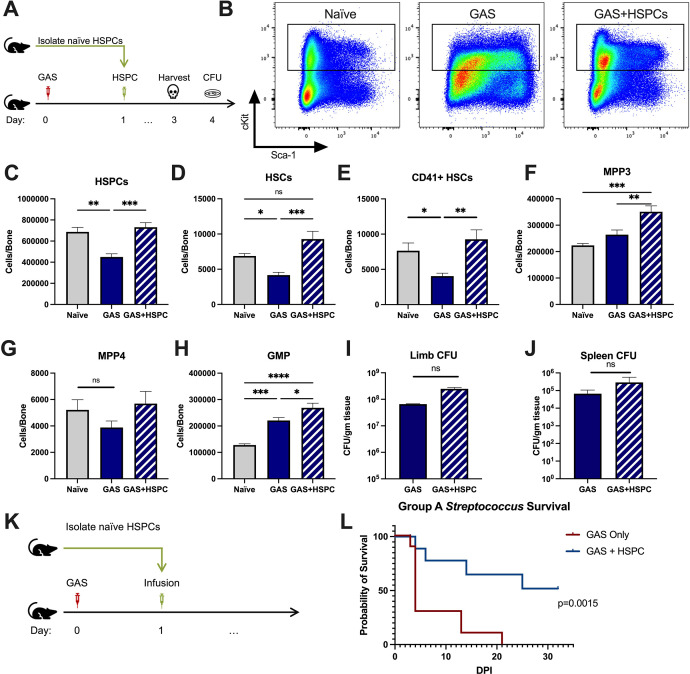
Figure 4. Hematopoietic stem and progenitor cell (HSPC) infusion in Group A Streptococcus (GAS)-infected mice promotes survival and increases progenitor populations in the bone marrow (BM).
(A) Experimental design of BM analysis and colony forming unit (CFU) count after HSPC infusion. (B) Flow plot of HSPC gating and representation of different surface expression of cKit and Sca-1 during infection. Plots are gated from lineage negative BM cells. (C–H) Absolute numbers of HSPCs, hematopoietic stem cells (HSCs), and downstream progenitors in the BM of naïve, GAS-infected mice, and GAS-infected mice rescued with HSPCs. Quantified bacterial load in the (I) limb and (J) spleen of infected mice. (K) Experimental design of the survival study. (J) Survival curve of GAS-infected mice with or without HSPC infusion. Data representative of three independent experiments; (C–H) n = 5–7 mice/group, (I and J) n = 8–10 mice/group, (L) n = 9–10 mice/group. Statistical comparison done using (C–H) one-way ANOVA with Tukey’s correction for multiple comparisons or (I and J) unpaired t-tests. ns = not significant, *p < 0.05, **p < 0.01, ***p < 0.001, *****p < 0.0001. Comparison of (L) survival was done using Log-rank (Mantel-Cox) test.

