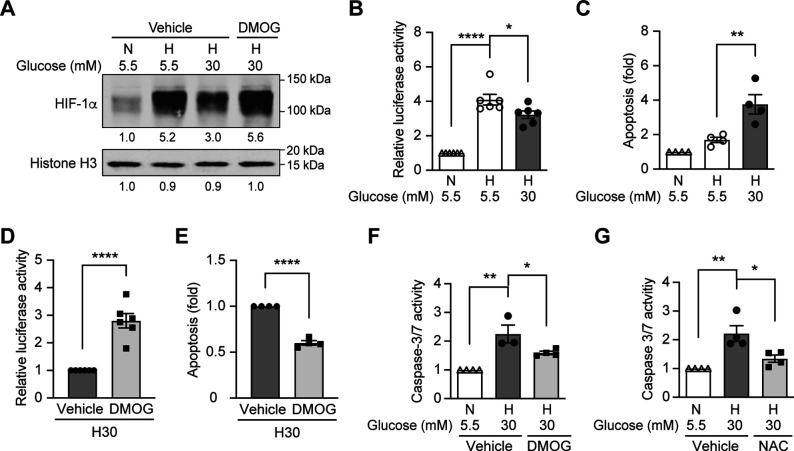
Figure 2. High glucose levels inhibit HIF-1 signaling and induce apoptosis, which can be rescued by PHD inhibitor DMOG.
(A) mIMCD-3 cells were cultured in normal (5.5 mM) or high (30 mM) glucose media in the presence of DMOG or vehicle for 24 hr, and were exposed to hypoxia (H) or normoxia (N) for 6 hr before harvest. The nuclear expression of HIF-1α and Histone H3 was measured using western blotting. (B–F) mIMCD-3 cells were exposed to 5.5 or 30 mM glucose levels in normoxia (N) or hypoxia (H) in the presence or absence of DMOG or vehicle for 24 hr. The relative HRE-driven luciferase activity (B and D, n = 6), apoptosis (C and E, n = 4), and the caspase 3/7 activity (F, n = 3–4) were assessed. (G) Caspase 3/7 activity was evaluated in mIMCD-3 cells that were pre-treated with 1 mM NAC or vehicle for 1 hr before exposure to 5.5 or 30 mM glucose levels in normoxia (N) or hypoxia (H) for 24 hr (n = 4). The data under control conditions were considered as 1.0. Data are shown as mean ± SEM. *, p < 0.05; **, p < 0.01; ***, p < 0.001; ****, p < 0.0001 using one-way ANOVA followed by Bonferroni’s post hoc test (B–C, F–G), and unpaired two-sided Student t-test (D–E). This figure has one figure supplement. Source data are shown in Figure 2—source data 1.


