. 2022 Feb 3;11:e72071. doi: 10.7554/eLife.72071

Figure 2. Chemotactic response is impaired in diabetic neutrophils through FPR.

(a–b) Neutrophils were isolated from the peripheral blood of C57BL/6 and db/db animals to assess: (a) their ability to chemotax toward 100 nM fMLP, or (b) for the expression of FPR1 by Western blotting. (c) Densitometry values associated with (b) are plotted as Mean ± SEM (N = 4 blood pools/group, each blood pool was from 4 mice). (d) Equal number of neutrophils (isolated from Day 1 C57B and db/db wounds) were assessed for the surface expression of FPR1 on neutrophils by flow cytometry (N = 3 mice/group). (e–f) Purified neutrophils from peripheral blood of non-diabetic individuals (e), or C57BL/6 bone marrow (f), were exposed to media containing glucose in normal range (90 mg/dl) or in diabetic range (200–500 mg/dl) for 1 hr to assess their ability to chemotax toward 100 nM fMLP. Data are plotted as Mean ± SEM. (N > 4). (g–h) Neutrophils from C57BL/6 bone marrow were exposed to glucose in normal range (90 mg/dl) or in diabetic range (300 mg/dl) for 1 hr and assessed for surface expression of FPR1 by flow cytometry. A representative histogram is shown in (g) and the corresponding tabulated data, plotted as Mean ± SEM is shown in (h) (N = 3). (i–j) Murine neutrophils (from C57B bone marrow) were exposed to glucose in normal or diabetic range (90 mg/dl or 300 mg/dl) for 1 hr and assessed for the expression of indicated proteins by Western blotting. Representative Western blots are shown in (i) and corresponding densitometry values, plotted as Mean ± SEM, are shown in (j). (N ≥ 3 independent experiments). (k–m) Murine neutrophils exposed to normal or diabetic glucose, as described for (g–h), were assessed for Cyclic AMP production by ELISA (k), and for mRNA of Fpr1 and Plcγ by RT-PCR (l-m). (N ≥ 3, ns = not significant, *p < 0.05, **p < 0.01, ***p < 0.001. Statistical analyses between groups were conducted by One-way ANOVA with additional post hoc testing, and pair-wise comparisons between groups were performed or by unpaired Student’s t-test).

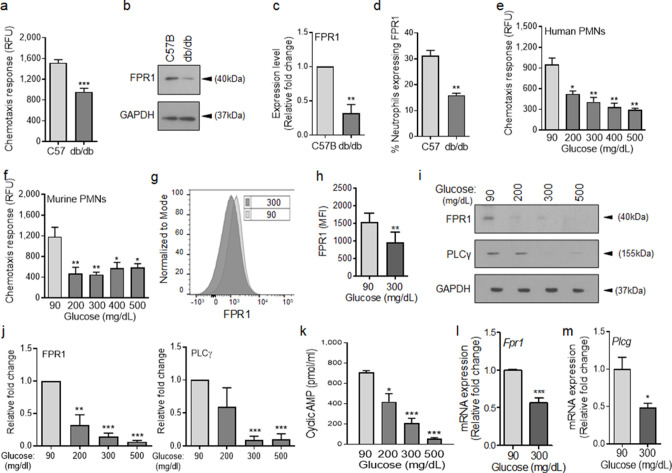
Figure 2—source data 1. Related to Figure 2a.
Figure 2—source data 2. Related to Figure 2b.
Figure 2—source data 3. Related to Figure 2c.
Figure 2—source data 4. Related to Figure 2d.
Figure 2—source data 5. Related to Figure 2e.
Figure 2—source data 6. Related to Figure 2f.
Figure 2—source data 7. Related to Figure 2h.
Figure 2—source data 8. Related to Figure 2i.
elife-72071-fig2-data8.pptx (124.9KB, pptx)
Figure 2—source data 9. Related to Figure 2j.
Figure 2—source data 10. Related to Figure 2k.
Figure 2—source data 11. Related to Figure 2l.
Figure 2—source data 12. Related to Figure 2m.
mRNA data for Plcγ by RT-PCR.

Figure 2.

Figure 2—figure supplement 1. Chemotactic response is impaired in diabetic neutrophils through FPR.

Figure 2—figure supplement 1.

(a–b) Neutrophils (PMNs) were purified from murine (C57BL/6 bone marrow) and human peripheral blood, as discussed in Materials and Methods. Representative images of mouse and human purified neutrophils are shown at indicated magnification. Magnified representative regions are shown inserts within each image. (Red scale bars are 50 μm). (c) Representative flow histograms of purified mouse neutrophils showing that these neutrophils are over 97% pure, live, and naive, as assessed by indicated markers. (d) Chemotaxis of purified mouse PMNs toward varying concentrations of fMLP after 1 hr exposure to normal glucose (90 mg/dl) or high glucose in diabetic range (300 mg/dl). Data are plotted as the Mean ± SEM. (N = 3; ns = not significant. *p < 0.05, **p < 0.01, ***p < 0.001. Statistical analyses between groups were conducted by Two-way ANOVA with additional post hoc testing, and pair-wise comparisons between groups were performed or by unpaired Student’s t-test).
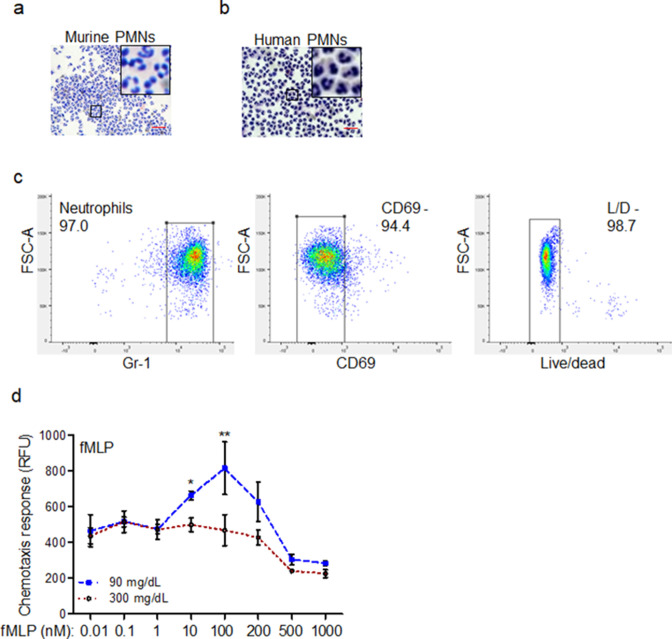
Figure 2—figure supplement 1—source data 1. Related to Figure 2—figure supplement 1d.
Figure 2—figure supplement 2. Exposure to high glucose dampens the expression of FPR1 in neutrophils.

Figure 2—figure supplement 2.

(a–c) Murine neutrophils were extracted from the bone marrow of C57BL/6 mice and exposed to normal glucose (90 mg/dl) or high glucose (300 mg/dl) and the expression of FPR1 was assessed by RT-PCR (a), or by western blotting (b–c) after 1, 2, or 3 hr exposure to glucose. Data are plotted as Mean ± SEM. (N ≥ 5 for RT-PCR and N = 4 for Western blotting. ns = not significant, *p < 0.05, **p < 0.01, ***p < 0.001. Statistical analyses between groups were conducted by One-way ANOVA with additional post hoc testing, and pair-wise comparisons between groups were performed or by unpaired Student’s t-test).
Figure 2—figure supplement 2—source data 1. Related to Figure 2—figure supplement 2a.
Figure 2—figure supplement 2—source data 2. Related to Figure 2—figure supplement 2b.
Figure 2—figure supplement 2—source data 3. Related to Figure 2—figure supplement 2c.
Figure 2—figure supplement 3. Exposure to high glucose dampens the expression of FPR2 in neutrophils.

Figure 2—figure supplement 3.

(a–c) Murine neutrophils were extracted from the bone marrow of C57BL/6 mice and exposed to normal glucose (90 mg/dl) or high glucose (300 mg/dl) and the expression of FPR2 was assessed by RT-PCR (a), or by western blotting (b–c) after 1, 2, or 3 hr exposure to glucose. Data are plotted as Mean ± SEM. (N ≥ 3 for RT-PCR and N = 4 for Western blotting. ns = not significant, *p < 0.05, **p < 0.01, ***p < 0.001. Statistical analyses between groups were conducted by One-way ANOVA with additional post hoc testing, and pair-wise comparisons between groups were performed or by unpaired Student’s t-test).
Figure 2—figure supplement 3—source data 1. Related to Figure 2—figure supplement 3a.
Figure 2—figure supplement 3—source data 2. Related to Figure 2—figure supplement 3b.
Figure 2—figure supplement 3—source data 3. Related to Figure 2—figure supplement 3c.