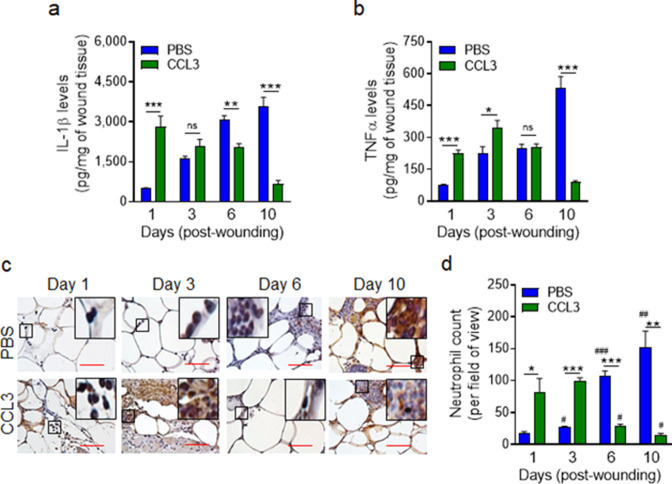
Figure 5. Treatment with CCL3 does not lead to persistent inflammation in infected diabetic wounds.
db/db wounds were treated with PBS or CCL3 (1 μg/wound) and infected with PA103 (1000 CFU/wound). (a–b) Wound tissues were collected at indicated timepoints and assessed for their Il-1β (a) and TNF-α (b) contents by ELISA. (N = 4 mice/group). (c–d) The aforementioned PBS and CCL3-treaded and infected diabetic wounds were assessed for their neutrophil contents by histological analysis using neutrophil marker Ly6G staining. (c) Representative images of regions from underneath the wounds extending in the dermis at ×400 magnification are shown. (Red scale bars = 50 μm). Representative full wound images of these staining can be found in Figure 5—figure supplement 1. (d) The corresponding data were plotted as the Mean ± SEM. (N = 4 mice/group, > 9 random fields/wound/mouse. (*) denotes significance between groups while (#) indicates significance within the same group in comparison to day 1 of respective wound groups. ns = not significant; *p < 0.05, **p < 0.01, ***p < 0.001, #p < 0.05, ##p < 0.01, ###p < 0.001. Statistical analyses between groups were conducted by One-way ANOVA with additional post hoc testing, and pair-wise comparisons between groups were performed or by unpaired Student’s t-test).


