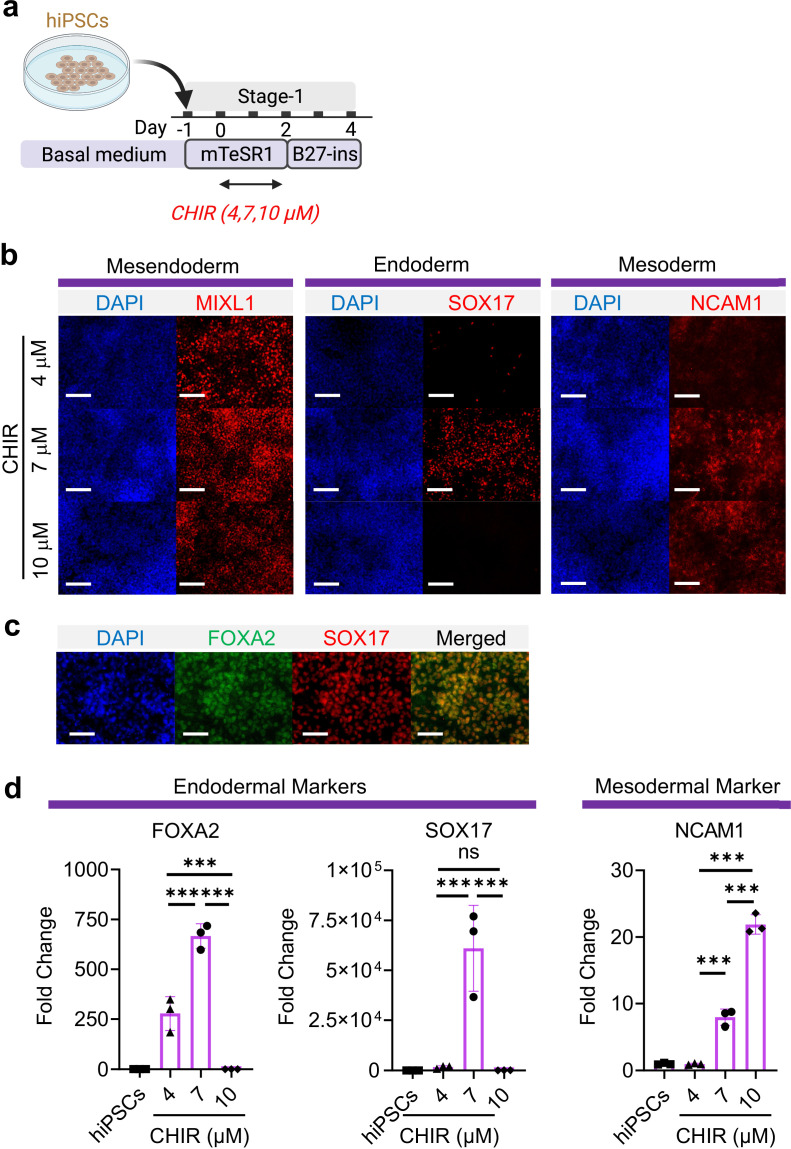
Figure 1. Mesoderm and endoderm co-induction from hiPSCs using CHIR.
(a) Diagram showing the experimental design (b) Cells following Stage-1 differentiation expressed MIXL1 (Mesendodermal lineage), SOX17 (definitive endoderm), and NCAM1 (mesoderm). Scale bar = 125 μm. (c) Majority of SOX17 cells were also FOXA2+. Scale bar = 62.5 μm. (d) Fold change of hiPSCs for FOXA2 (n = 3 each; 4 vs 7, p < 0.001; 7 vs 10, p < 0.001; 4 vs 10, p < 0.001), SOX17 (n = 3 each; 4 vs 7, p < 0.001; 7 vs 10, p < 0.001; 4 vs 10, p = 0.9978) and NCAM1 (n = 3 each; 4 vs 7, p < 0.001; 7 vs 10, p < 0.001; 4 vs 10, p < 0.001). All data are mean ± SD. *p < 0.05; **p < 0.01; ***p < 0.001. ‘n’ refers to biological replicates. Diagram created using BioRender (http://biorender.com/).


