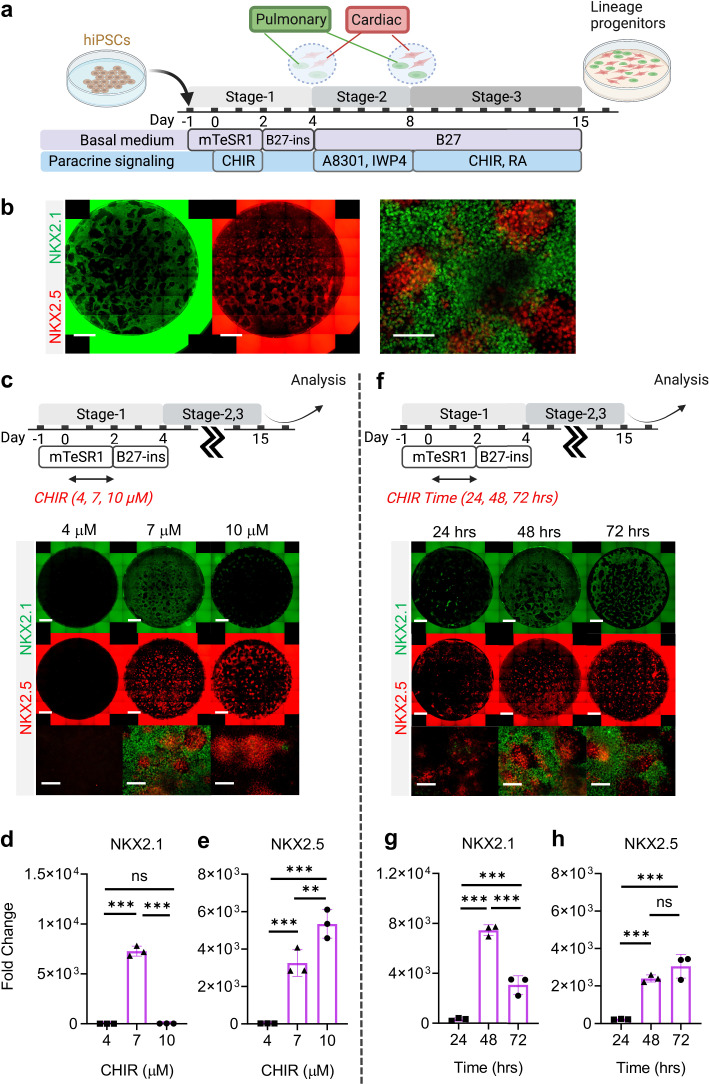
Figure 2. Stepwise cardio-pulmonary co-differentiation from hiPSCs using chemical defined, growth factor-free protocol.
(a) Schematic diagram showing the overall differentiation strategy. (b) Immunofluorescence (IF) showing staining of lung (NKX2.1+) and cardiac (NKX2.5+). (c) IF (d,e) and quantitative PCR (qPCR) analysis of the induction of lung and cardiac progenitors on Day-15 of differentiation. (c–e) The effects of different CHIR concentrations during Stage-1 of differentiation. Fold change over hiPSCs (d) NKX2.1 (n = 3 each; 4 vs 7, p < 0.001; 7 vs 10, p < 0.001; 4 vs 10, p = 0.9993) and (e) NKX2.5 (n = 3 each; 4 vs 7, p< 0.001; 7 vs 10, p = 0.0053; 4 vs 10, p < 0.001). (f–h) The effects of different exposure time of CHIR (7 µM) treatment during the first 2 days of differentiation. qPCR analysis of (g) NKX2.1 (n = 3 each; 24 vs 48, p < 0.001; 48 vs 72, p < 0.001; 24 vs 72, p < 0.001) and (h) NKX2.5 (n = 3 each; 24 vs 48, p < 0.001; 48 vs 72, p = 0.1503; 24 vs 72, p < 0.001). Scale bar = 500 μm for whole well scan; Scale bar = 125 μm for 20 X images. All data are mean ± SD. *p < 0.05; **p < 0.01; ***p < 0.001. ‘n’ refers to biological replicates. Diagram created using BioRender (http://biorender.com/).


