. 2022 Jan 12;11:e67872. doi: 10.7554/eLife.67872

Figure 3. The effect of Nodal and BMP signaling during Stage-1 of co-differentiation on cardio-pulmonary induction.

IF (a,d) and qPCR (b,c,e,f) analysis of the induction of lung (NKX2.1+) and cardiac (NKX2.5+) progenitors on Day-15 of differentiation (a–c) The effects of exogenous nodal activation (Activin A, 20 ng/mL) or its inhibition (A8301, 1 µM). Fold change over hiPSCs for (b) NKX2.1 (n = 3 each; Activin A /A8301 vs. Activin A+ /A8301, p = 0.1939; Activin A /A8301 vs. Activin A /A8301+, p < 0.001; Activin A+ /A8301 vs. Activin A /A8301+, p < 0.001) and (c) NKX2.5 (n = 3 each; Activin A /A8301 vs. Activin A+ /A8301, p < 0.001; Activin A /A8301 vs. Activin A /A8301+, p < 0.001; Activin A+ /A8301 vs. Activin A /A8301+, p = 0.8649). (d-f) The effects of exogenous BMP4 (20 ng/mL) or BMP inhibitor (DMH1, 2 µM). qPCR analysis of (e) NKX2.1 (n = 3 each; BMP4 /DMH1 vs. BMP4+ /DMH1, p < 0.001; BMP4 /DMH1 vs. BMP4 /DMH1+, p < 0.001; BMP4+ /DMH1 vs. BMP4 /DMH1+, p < 0.001) and (f) NKX2.5 (n = 3 each; BMP4 /DMH1 vs. BMP4+ /DMH1, p < 0.001; BMP4 /DMH1 vs. BMP4 /DMH1+, p = 0.0044; BMP4+ /DMH1 vs. BMP4 /DMH1+, p < 0.001). Scale bar = 500 μm for whole well scan; Scale bar = 125 μm for 20 X images. All data are mean ± SD. *p < 0.05; **p < 0.01; ***p < 0.001. ‘n’ refers to biological replicates. Diagram created using BioRender (http://biorender.com/).

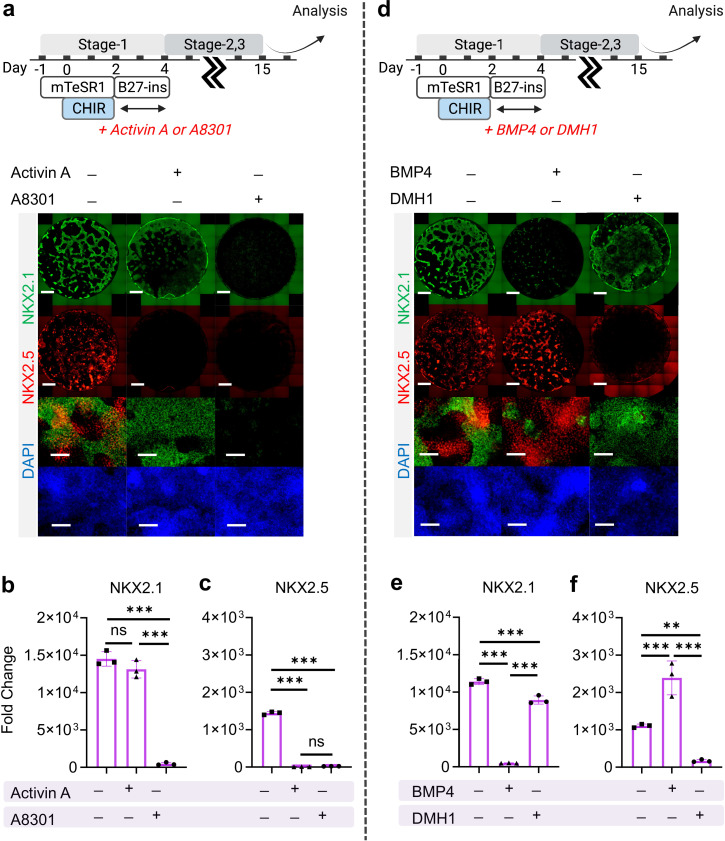
Figure 3—source data 1. Raw data for Figure 3b, c, e and f.

Figure 3.

Figure 3—figure supplement 1. Initial co-induction medium for CHIR-directed differentiation.

Figure 3—figure supplement 1.

Cells were induced by CHIR in (a) mTESR1 (b) and RPMI-based medium, followed by representative IF staining of NKX2.1 and NKX2.5 following 15 days of differentiation. Scale bar = 500 μm for whole well scan; Scale bar = 125 μm for 20 X images. Diagram created using BioRender (http://biorender.com/).
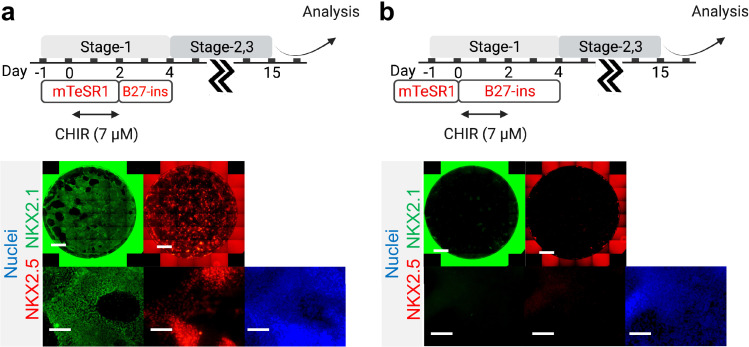
Figure 3—figure supplement 2. Combination of TGF-β and WNT inhibition during Stage-2 of co-differentiation is required for cardio-pulmonary induction.

Figure 3—figure supplement 2.

(a) Schematic diagram illustrating the experimental design. (b–d) IF staining showing NKX2.1 and NKX2.5 expression on Day-15 of differentiation (b), and the corresponding qPCR analysis of (c) NKX2.1 (n = 3 each; A8301+ /IWP4+ vs. A8301+ /IWP4, p < 0.001; A8301+ /IWP4+ vs. A8301 /IWP4+, p < 0.001; A8301+ /IWP4 vs. A8301 /IWP4+, p < 0.001) and (d) NKX2.5 (n = 3 each; A8301+ /IWP4+ vs. A8301+ /IWP4, p < 0.001; A8301+ /IWP4+ vs. A8301 /IWP4+, p < 0.001; A8301+ /IWP4 vs. A8301 /IWP4+, p = 0.9986). Scale bar = 500 μm for whole well scan; Scale bar = 125 μm for 20 X images. All data are mean ± SD. *p < 0.05; **p < 0.01; ***p < 0.001. Diagram created using BioRender (http://biorender.com/).
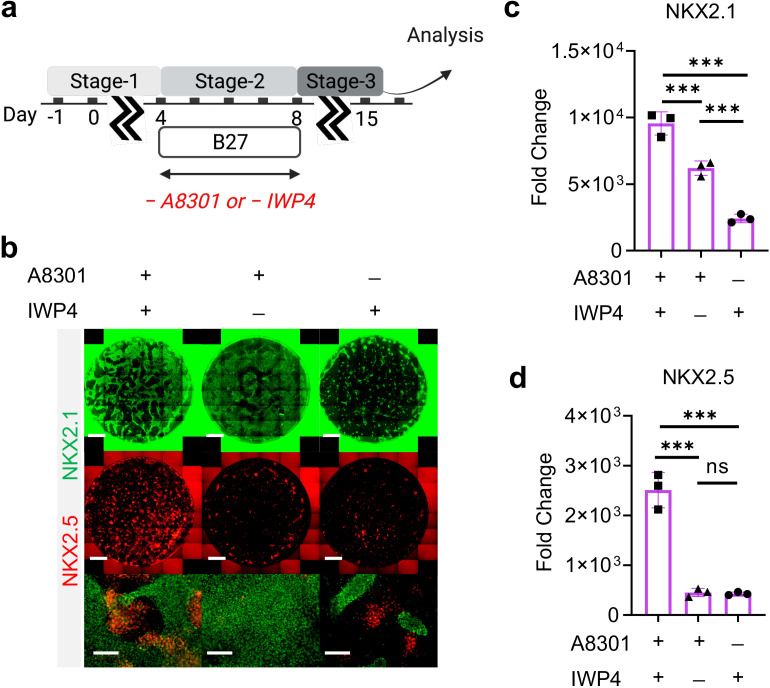
Figure 3—figure supplement 2—source data 1. Raw data for Figure 3—figure supplement 2c,d.
Figure 3—figure supplement 3. Roles of BMP4 during Stage-3 of co-differentiation.

Figure 3—figure supplement 3.

(a) Schematic diagram illustrating the experimental design. (b) IF staining showing NKX2.1 and NKX2.5 expression on Day-15 of differentiation, and the corresponding qPCR analysis of (c) NKX2.1 (n = 3 each; BMP4 /DMH1 vs. BMP4+ /DMH1, p = 0.9737; BMP4 /DMH1 vs. BMP4 /DMH1+, p < 0.01; BMP4+ /DMH1vs. BMP4 /DMH1+, p = 0.0128) and (d) NKX2.5 (n = 3 each; BMP4 /DMH1 vs. BMP4+ /DMH1, p = 0.3330; BMP4 /DMH1 vs. BMP4 /DMH1+, p < 0.001; BMP4+ /DMH1vs. BMP4 /DMH1+, p < 0.01). Scale bar = 500 μm for whole well scan; Scale bar = 125 μm for 20 X images. All data are mean ± SD. *p < 0.05; **p < 0.01; ***p < 0.001. Diagram created using BioRender (http://biorender.com/).
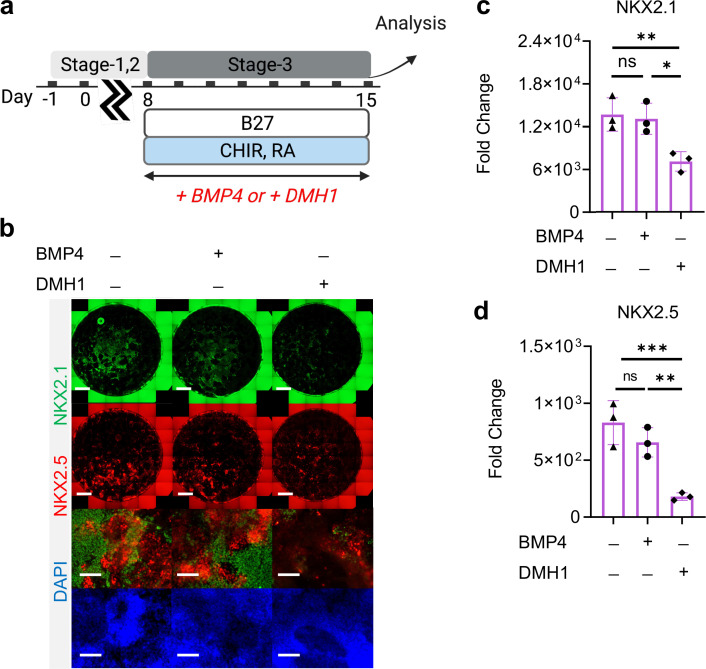
Figure 3—figure supplement 3—source data 1. Raw data for Figure 3—figure supplement 3c,d.