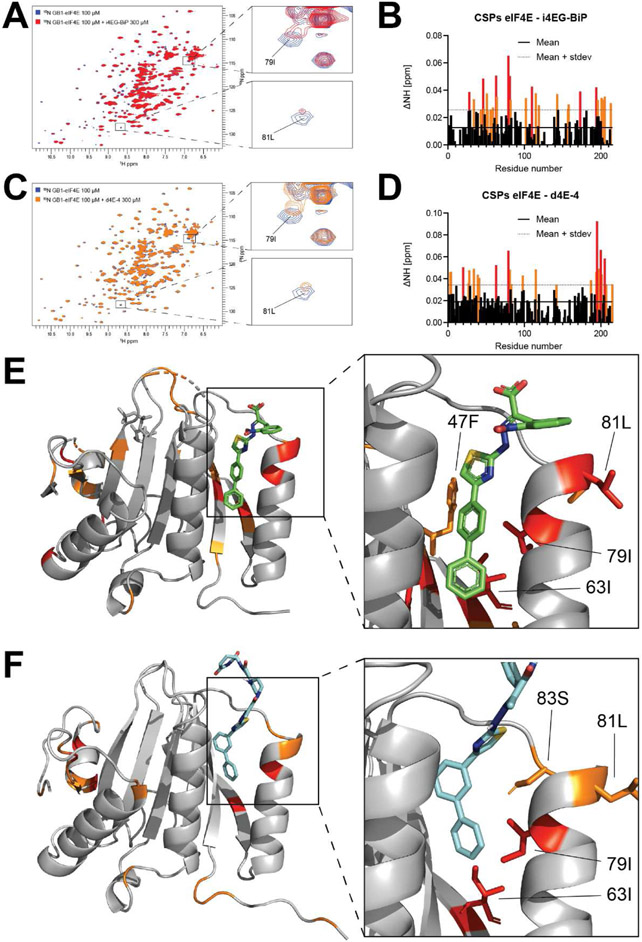
Figure 10.
A. 15N-1H-HSQC overlay of GB1-eIF4E in the absence (blue) and presence (red) of i4EG-BP. B. Chemical shift perturbation (CSP) plot of changes induced by i4EG-BP as a function of residue number. The solid line represents the mean value of all CSPs, the dashed line represents the mean value plus one standard deviation of all CSPs. C. 15N-1H-HSQC overlay of GB1-eIF4E in the absence (blue) and presence (orange) of d4E-4. D. CSP plot of changes induced by d4E-4 as a function of residue number. The solid line represents the mean value of all CSPs, the dashed line represents the mean value plus one standard deviation of all CSPs.E. CSPs plotted onto the eIF4E-i4EG-BP structure: Highlighted in orange are residues with CSPs > mean + one standard deviation, highlighted in red are residues with CSPs > mean + two standard deviations. F. CSPs plotted onto the docked eIF4E-d4E-4 structure. Highlighted in orange are residues with CSPs > mean + one standard deviation, highlighted in red are residues with CSPs > mean + two standard deviations.

