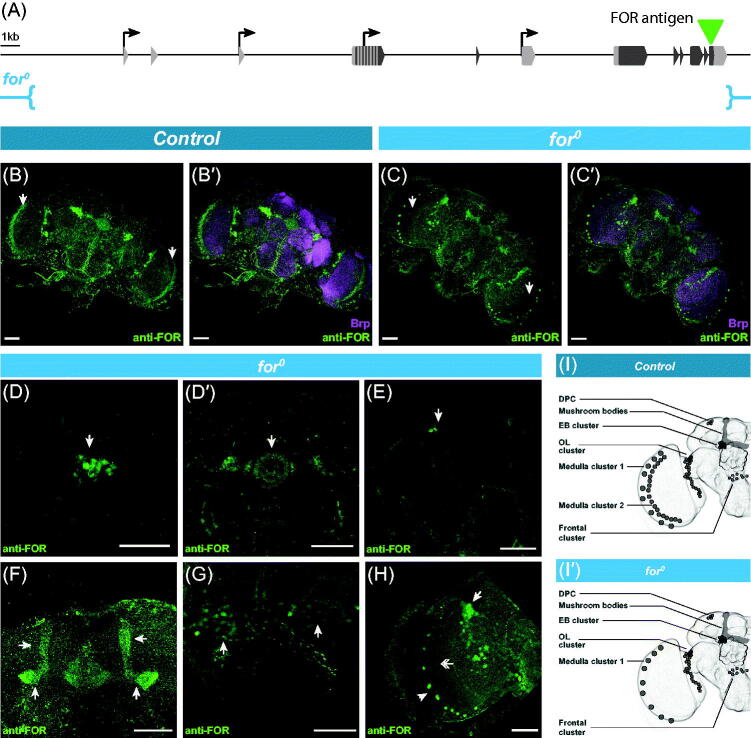
Figure 3.
(A) Schematic of the foraging gene (as in Figure 1(A)). The 120bp (40aa) antigenic region used to generate the polyclonal anti-FOR antibody is depicted with a green arrowhead (described in Belay et al., 2007). The for0 genetic deletion (described in Allen et al., 2017) and its break points (in blue) are depicted below. (B) Maximal projection of anti-FOR antibody staining in control animals of late pupal brains (4 days post-puparium formation). Arrows in optic lobes indicating cells with morphology consistent with outer optic chiasm glia. Neuropil visualised with anti-Brp (B′). (C) Maximal projection of anti-FOR antibody staining in for0 null mutant (described in Allen et al., 2017) animals of late pupal brains (4 days post-puparium formation). Arrows in optic lobes indicating lack of expression in cells with morphology consistent with outer optic chiasm glia. Neuropil visualized with anti-Brp (C′). (D–H) Magnification of anti-FOR positive clusters in the for0 null mutant. Immunoreactivity in the ellipsoid body cluster, EB cluster (arrow, D) and its projections into the ellipsoid body (arrow, D′). Staining was also seen in the 4 cells of the dorsal posterior cluster, DPC (arrow, E). Staining in the mushroom bodies (arrow, F). Staining in the frontal cluster (arrow, G). Staining in the optic lobe cluster, OL cluster (arrow, H), medulla cluster 1 (arrowhead, H), and absent in medulla cluster 2 (double arrow, H). (I–I′) Schematics of anti-FOR expression patterns in control and for0 null mutant animals. Expression in the for0 null mutant was the same as control except for the lack of medulla cluster 2. Scale bars = 50 µm. [Please refer to the online version for colors.]

