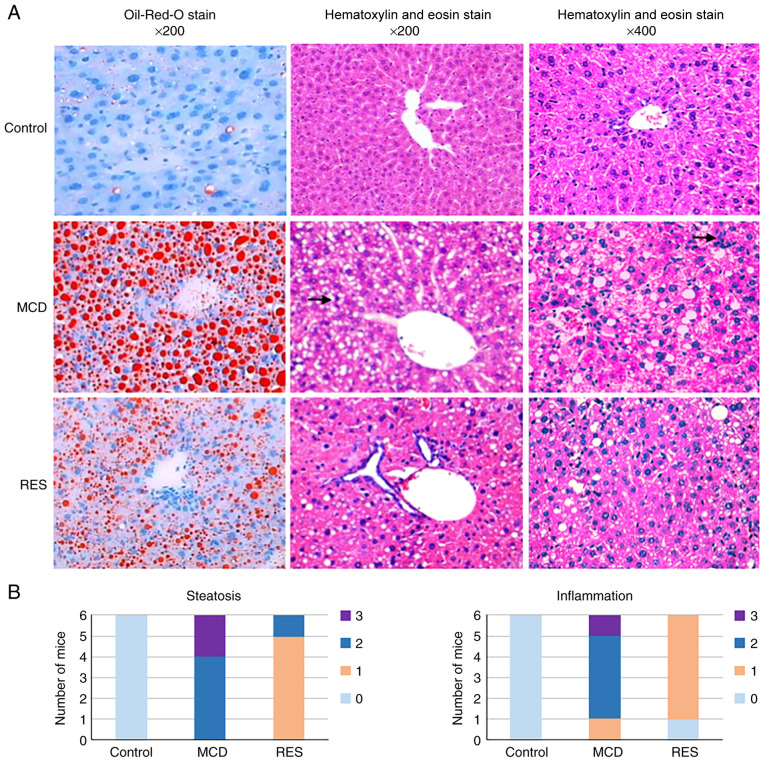
Figure 2.
Histopathological changes of mice under various treatment conditions. (A) Oil-Red-O stained (magnification, x200) and hematoxylin and eosin-stained (magnifications, x200 and x400) liver sections from Control, MCD and RES groups. Arrows indicate points of focal hepatocyte necrosis and inflammatory infiltration. (B) Distribution of mice with different pathological scores. MCD, methionine-choline-deficient; RES, MCD + resveratrol group.

