
Fig. 4.
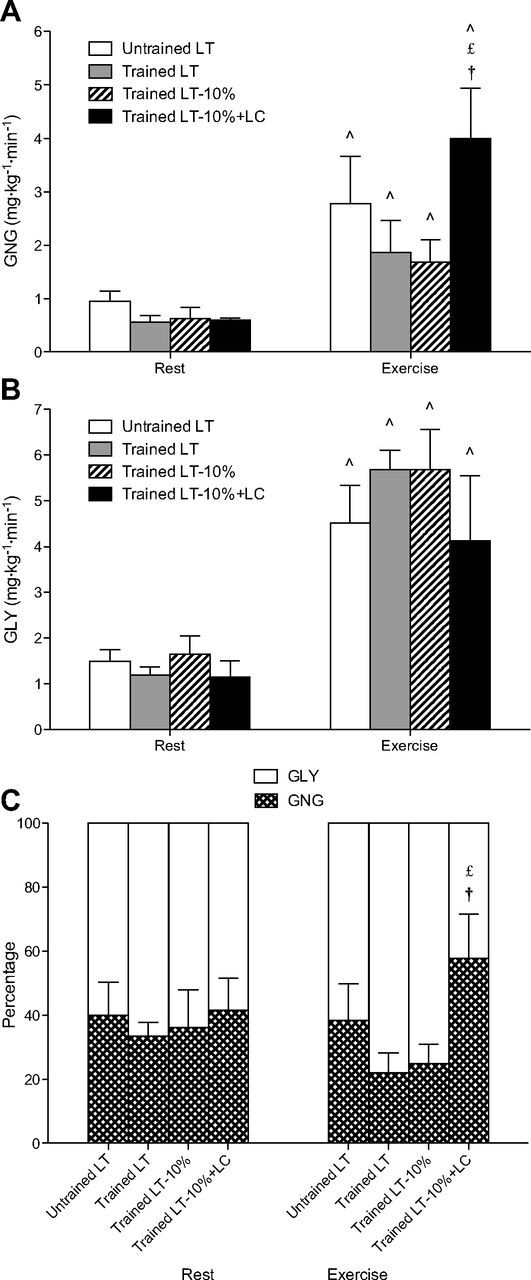
Steady-state rates of gluconeogenesis (GNG; A) and hepatic glycogenolysis (GLY; B), and partitioning of total glucose production in relative terms (C). Values are means ± SE; n = 6 for untrained and trained groups. ∧Significantly different from rest within condition (P < 0.05). £Significantly different from trained LT (P < 0.05). †Significantly different from trained LT-10% (P < 0.05).