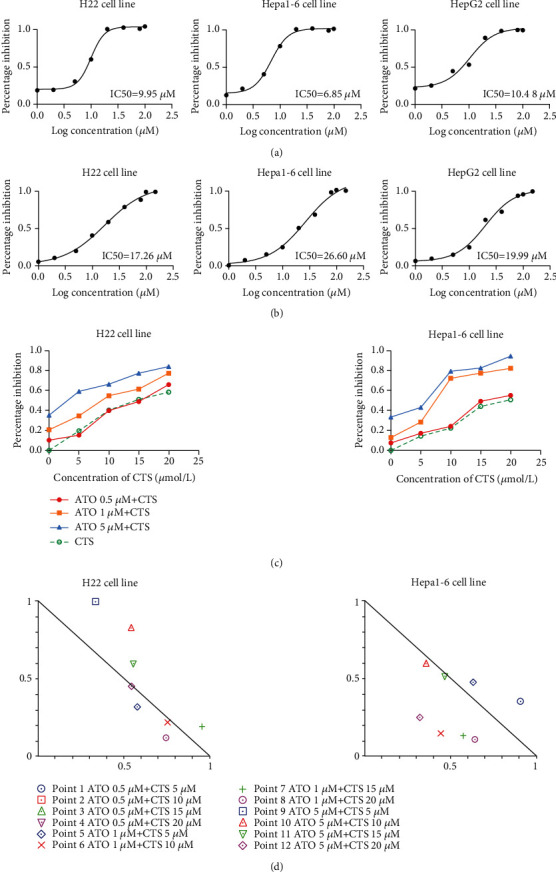
Figure 1.

Inhibition curve of different HCC cells. (a) Cells treated with ATO. (b) Cells treated with CTS. (c) Cells treated with the combination of ATO and CTS (ACCS). (d) Normalized isobologram for ACCS.

Inhibition curve of different HCC cells. (a) Cells treated with ATO. (b) Cells treated with CTS. (c) Cells treated with the combination of ATO and CTS (ACCS). (d) Normalized isobologram for ACCS.