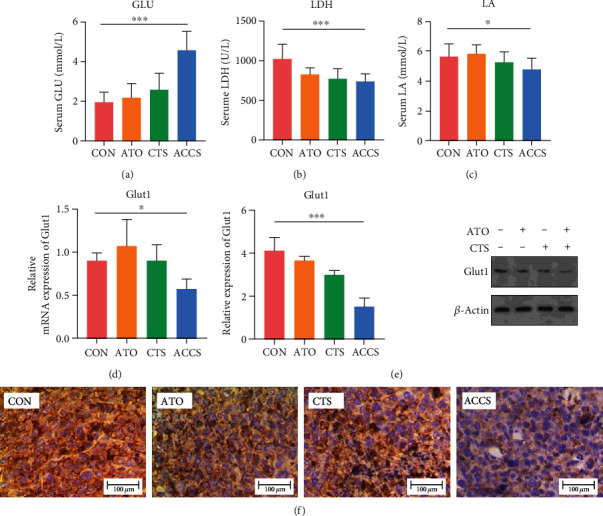
Figure 5.

The effect of ACCS on glycolysis in HCC mice. (a) Serum glucose level. (b) Serum lactate dehydrogenase level. (c) Serum lactic acid level. (d, e) The mRNA level and the protein level of Glut1 in tumor tissue. (f) Immunohistochemical staining of Glut1 in tumor tissue.
