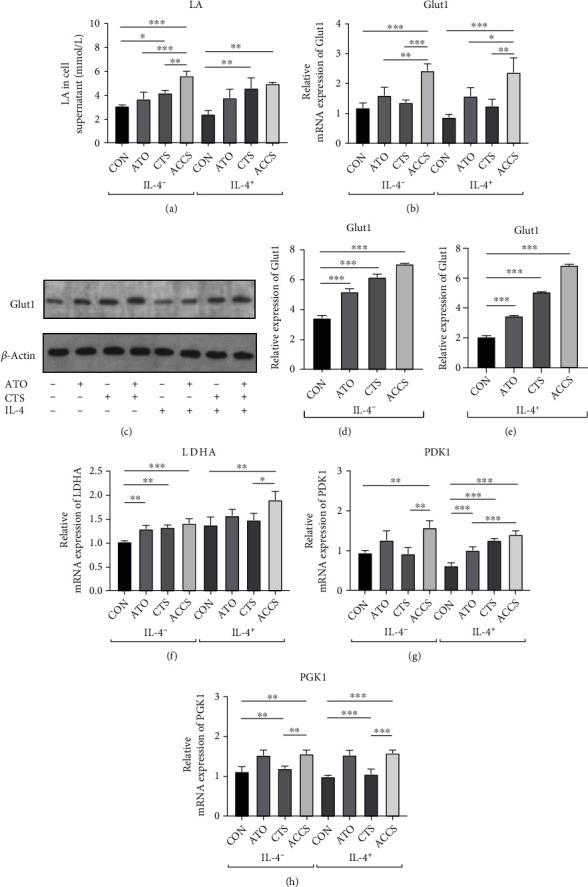
Figure 6.

Regulation of glycolysis in primary macrophages by ACCS intervention. (a) Levels of LA in the cell supernatant. (b) Levels of Glut1 gene expression. (c–e) Levels of Glut1 protein expression. (f–h) Gene expression levels of key rate-limiting enzymes in glycolytic metabolism.
