
Figure 4.
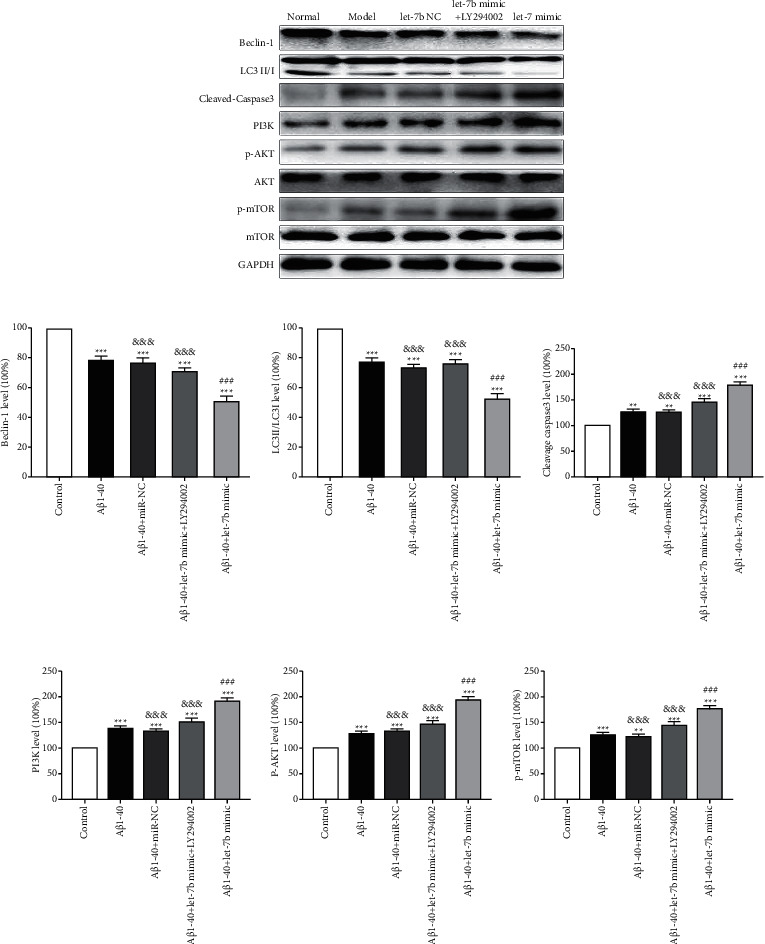
Effect of let-7b inhibitor on PI3K/AKT/mTOR signaling pathway. (a) Typical Western blot diagram of the expression of each molecule. (b) Statistical graphs of beclin-1 expression in each group. (c) Statistical graphs of LC3II/LC3I expression in each group. (d) Statistical graphs of cleavage caspase 3 expression in each group. (e) Statistical graphs of PI3K expression in each group. (f) Statistical graphs of p-AKT expression in each group. (g) Statistical graphs of p-MTOR expression in each group. n = 6, ∗ ∗p < 0.01, and ∗ ∗ ∗p < 0.001 versus control group; ###p < 0.001 versus Aβ1-40 group, and p < 0.01 versus Aβ1-40 + let-7b mimic group.