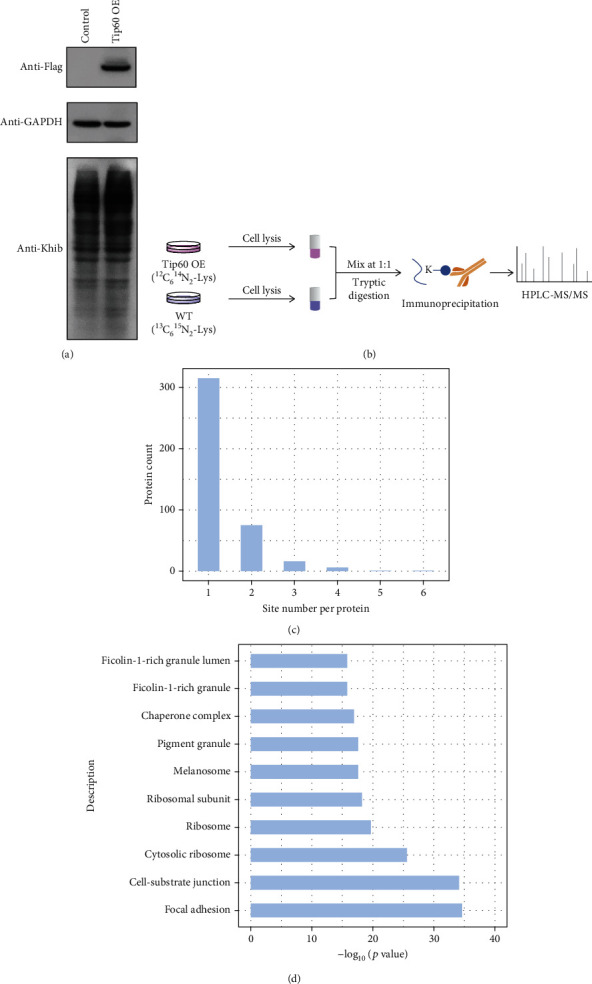
Figure 1.

Profiling of Khib proteome. (a) Validation of the Khib dynamics in response to Tip60 overexpression. (b) Schematic diagram of the protocol for identifying and quantifying Khib in WT and Tip60 OE cells. (c) Distribution of the amounts of Tip60-targeted Khib sites of each protein. (d) Cellular compartment distribution of Tip60-targeted Khib proteins.
