
Figure 3.
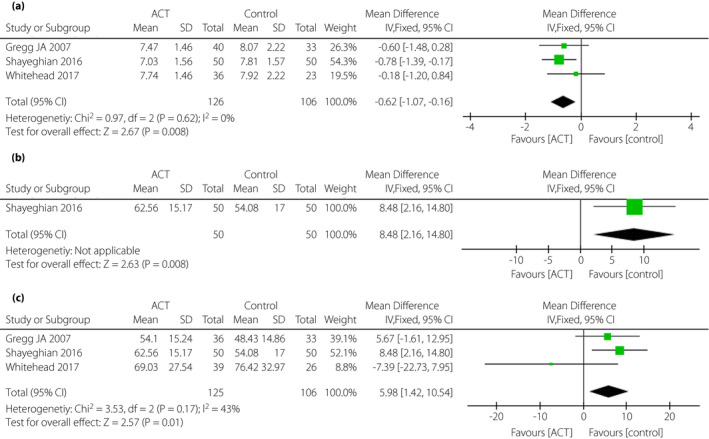
(a) Forest plot of comparison: glycated hemoglobin. (b) Forest plot of comparison: summary of diabetes self‐care activities score. (c) Forest plot of comparison: acceptance and action diabetes question score.
Official websites use .gov
A
.gov website belongs to an official
government organization in the United States.
Secure .gov websites use HTTPS
A lock (
) or https:// means you've safely
connected to the .gov website. Share sensitive
information only on official, secure websites.
(a) Forest plot of comparison: glycated hemoglobin. (b) Forest plot of comparison: summary of diabetes self‐care activities score. (c) Forest plot of comparison: acceptance and action diabetes question score.