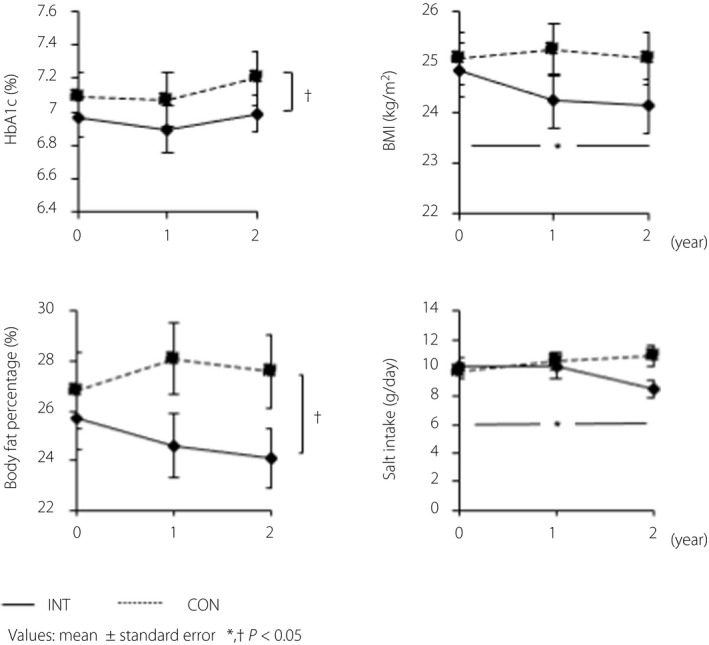
Figure 2.

Changes of clinical, physical and nutritional factors over the 2‐year study period. In the intensive intervention group (INT), both body mass index (BMI) and salt intake decreased significantly over the study period (P = 0.020 and P =0.023, respectively). In addition, hemoglobin A1c (HbA1c) and body fat percentage were significantly lower in the INT group than in the control (CON) group in a comparison that took into account changes over time during the 2‐year study period. (P = 0.047 and P = 0.003, respectively). No differences were observed for the other parameters. Values are presented as the mean ± standard error. The horizontal axis indicates the study period, whereas the vertical axis indicates the HbA1c levels, BMI, body fat percentage and salt intake. Changes in each item were analyzed by repeated measures analysis of variance or the Friedman test, whereas comparisons between the two groups were carried out using the two‐way analysis of variance or mixed‐effects models. *Significant differences in the change over time in each group; †significant differences in the change over time between the two groups.
