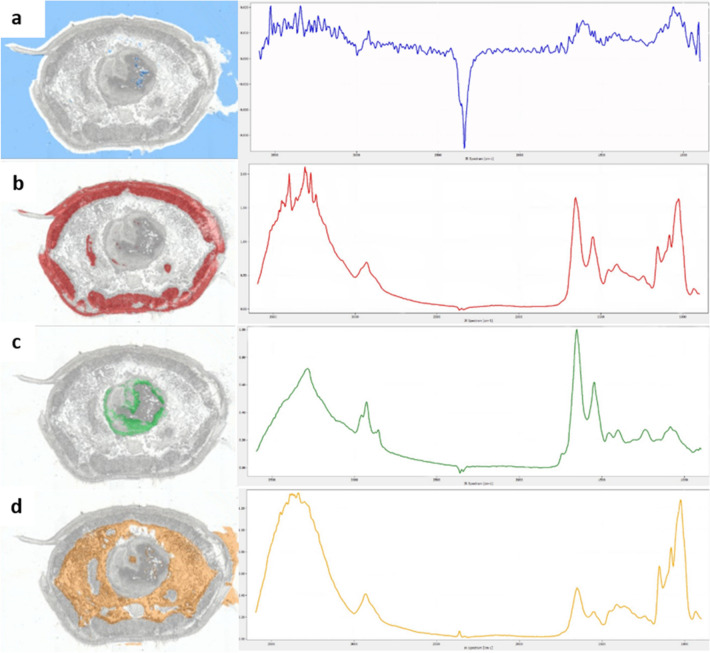
Fig. 2.
FTIR data analysis via random decision forest classification of a tissue section of E. fetida. a Result of the RDF application for class 1 “background” as overlay over the optical image of the section and an exemplary IR spectrum representing this class; this class is represented with blue coloration. b Result of the RDF application for class 2 “body wall” as overlay over the optical image of the section and an exemplary IR spectrum representing this class; this class is represented with red coloration. c Result of the RDF application for class 3 “digestive system” as overlay over the optical image of the section and an exemplary IR spectrum representing this class; this class is represented with green coloration. d Result of the RDF application for class 4 “other tissue” as overlay over the optical image of the section and an exemplary IR spectrum representing this class; this class is represented with orange coloration

