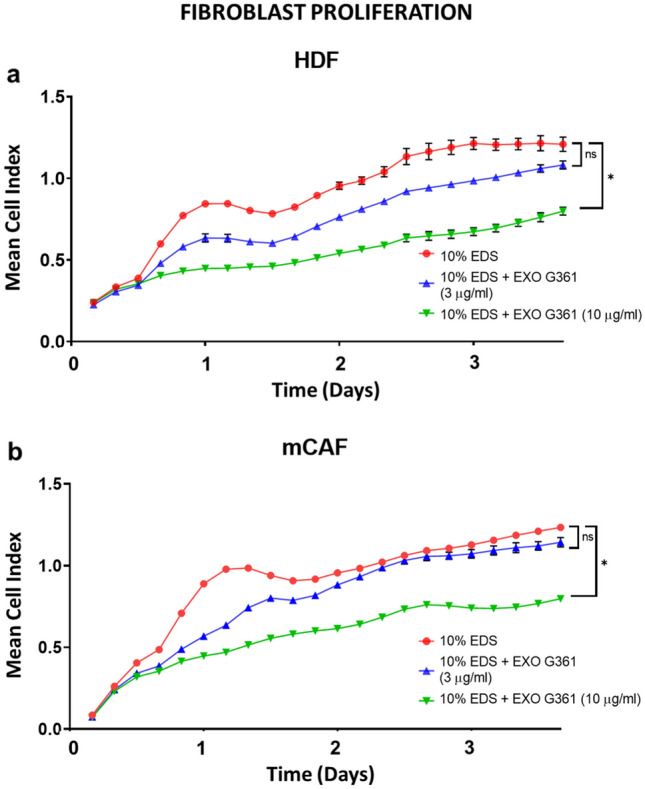
Fig. 3.

Exosomes decrease fibroblast proliferation. a The graph shows cell proliferation (90 h) of HDF as a mean cell index. b The graph shows mCAF proliferation (90 h) as a mean cell index. Time point 0 represents the point of cell addition onto the iCELLigence plate with exosomes (3 μg/ml blue, 10 μg/ml green) or without exosomes in DMEM + 10% EDS (red). Statistical significance (at the endpoint) was tested by Dunn’s post hoc multiple comparison test with Bonferroni correction (significant comparison with p value < 0.05 indicated by asterisk)
