Fig. 4.

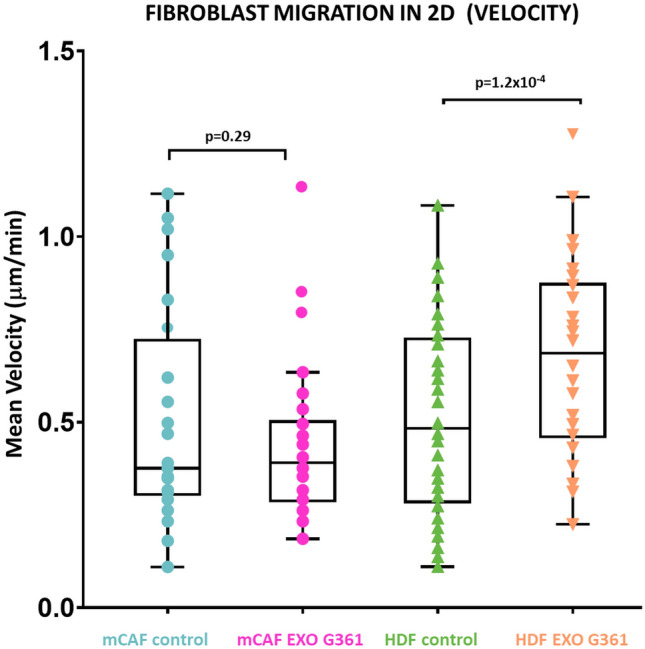
Exosomes increase the speed of cell migration in 2D. The box plot graph shows the cell speed differences between untreated and exosome-treated cells. p values indicate statistical significance calculated by a two-tailed Student’s t test

Exosomes increase the speed of cell migration in 2D. The box plot graph shows the cell speed differences between untreated and exosome-treated cells. p values indicate statistical significance calculated by a two-tailed Student’s t test