Fig. 5.
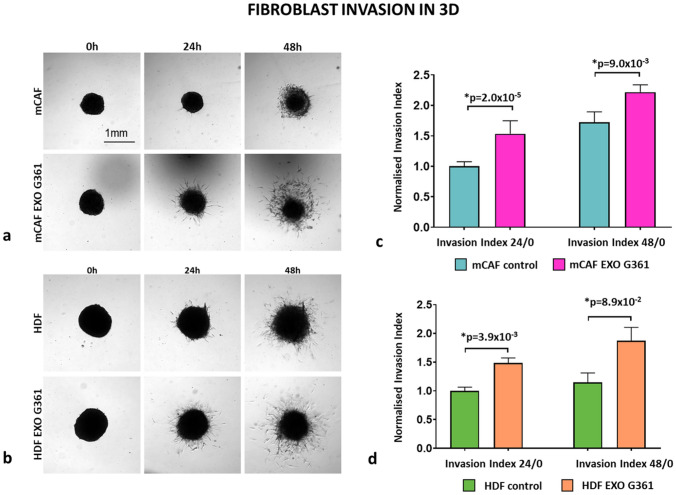
Exosomes enhance cell invasion in 3D. a 3D fibroblast spheroids formed of mCAF cells were treated with or without exosomes and imaged at time points 0, 24 and 48 h. The bar indicates 1 mm. b 3D fibroblast spheroids formed of HDF cells were treated with or without exosomes and imaged at time points 0, 24 and 48 h. c Bar graphs show the mean invasion index of mCAF cells at time points 24 and 48 h. d Bar graphs show the mean invasion index of HDF cells at time points 24 and 48 h. The p values in (c) and (d) indicate statistical significance calculated by two-tailed Student’s t test

