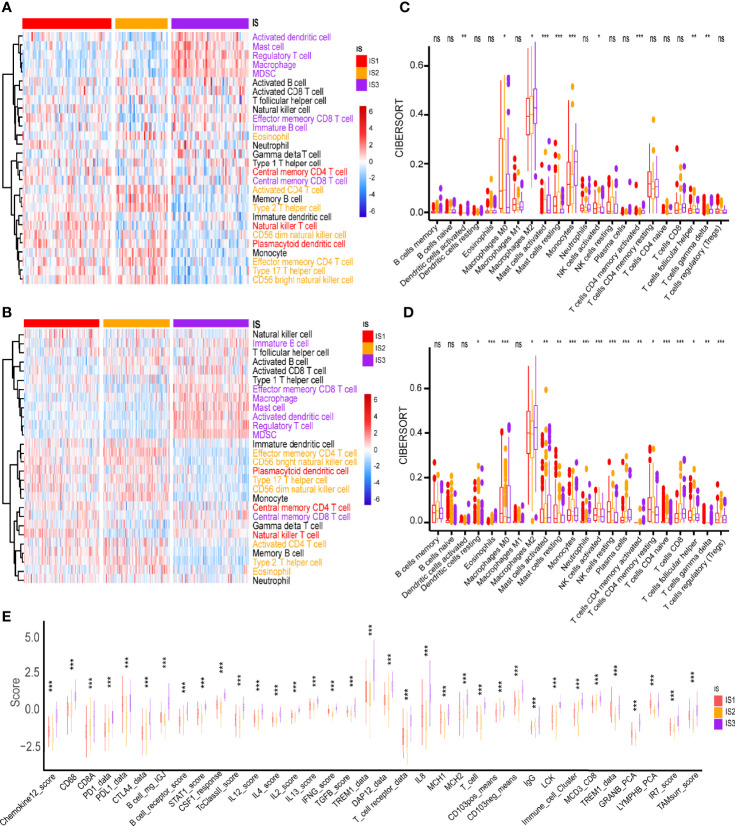
Figure 5.
Cellular and molecular characteristics of immune subtypes. Differential enrichment scores of 28 immune cell signatures among GBM immune subtypes in (A) TCGA and (B) CGGA cohorts. Different colors of the text on the right represents the immune cells were more enriched in the corresponding subtypes. Differential enrichment scores of CIBERSORT 22 immune cell signatures in (C) TCGA and (D) CGGA cohorts. (E) Differential enrichment scores of 56 immune signatures among GBM immune subtypes. *p < 0.05, **p < 0.01, ***p < 0.001. ns, no significance.

