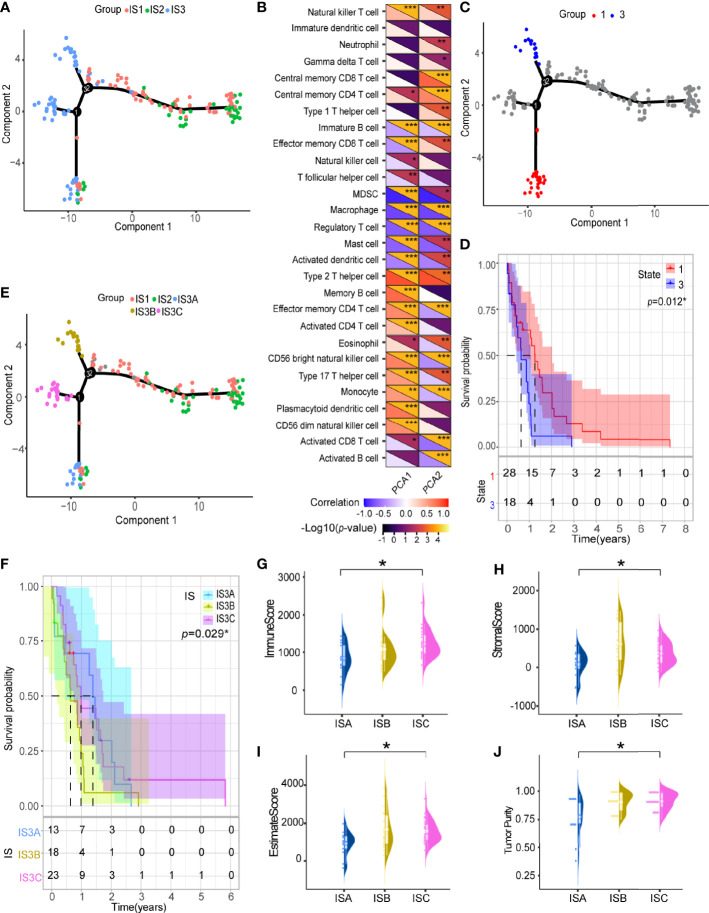
Figure 7.
Immune landscape of GBM. (A) Immune landscape of GBMs where each point represents a patient, and the immune subtypes are color-coded. The horizontal axis represents the first principal component, and the vertical axis represents the second principal component. (B) Heat map of two principal components with 28 immune cell signatures. Immune landscape of samples from (C) two extreme locations and (D) their prognostic status. (E) Immune landscape of the subsets of GBM immune subtypes. (F) Different subsets in IS3 associated with different prognoses. Immune assessment of different subsets in IS3, represented by (G) immune score, (H) stromal score, (I) estimate score and (J) tumor purity. *p < 0.05, **p < 0.01, ***p < 0.001.

