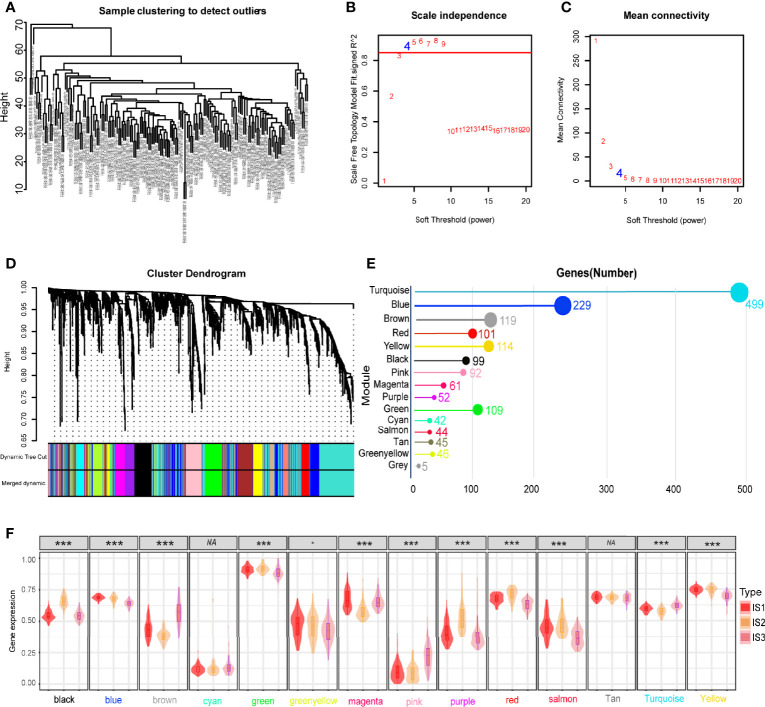
Figure 8.
Identification of immune gene co-expression modules of GBM. (A) Sample clustering. (B) Scale-free fit index for various soft-thresholding powers (β). (C) Mean connectivity for various soft-thresholding powers (D) Dendrogram of all differentially expressed genes clustered based on a dissimilarity measure (1-TOM). (E) Gene numbers in each module. (F) Differential distribution of feature vectors of each module in GBM subtypes. *p < 0.05, **p < 0.01, ***p < 0.001.

