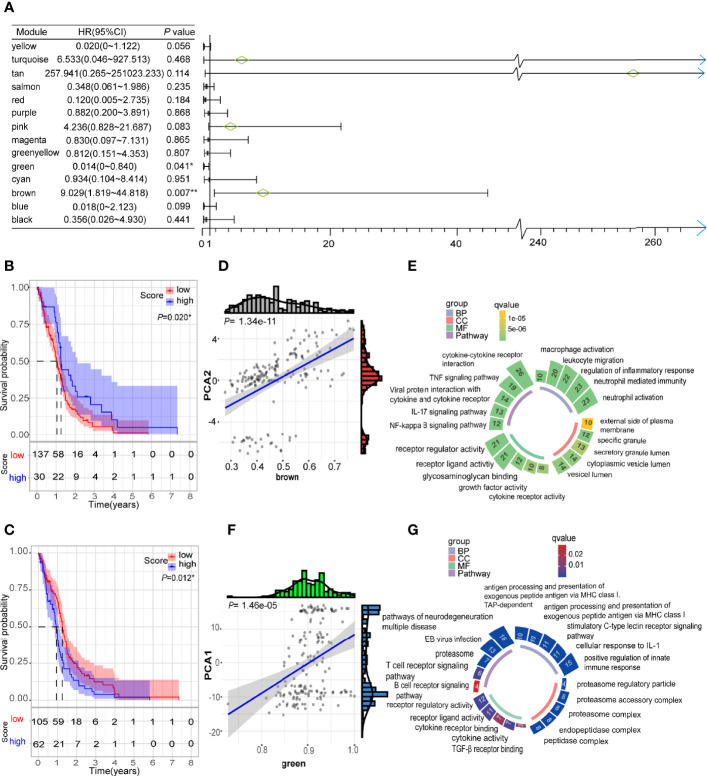
Figure 9.
Identification of immune hub genes of GBM. (A) Forest maps of single factor survival analysis of 14 modules of GBM. (B) Differential prognosis in brown module with high and low mean. (C) Differential prognosis in green module with high and low mean. (D) Correlation between brown module feature vector and second principal component in immune landscape. (E) Circular barplot showing GO term (BP: biology process; CC: cellular component; MF: molecular function) and KEGG term (pathway) in the brown module. The barplot size and color intensity represent the gene count and enrichment level respectively. (F) Correlation between green module feature vector and first principal component in immune landscape. (G) Circular barplot showing GO term (BP, biology process; CC, cellular component; MF, molecular function) and KEGG term (pathway) in the green module. The barplot size and color intensity represent the gene count and enrichment level respectively. *p < 0.05.

