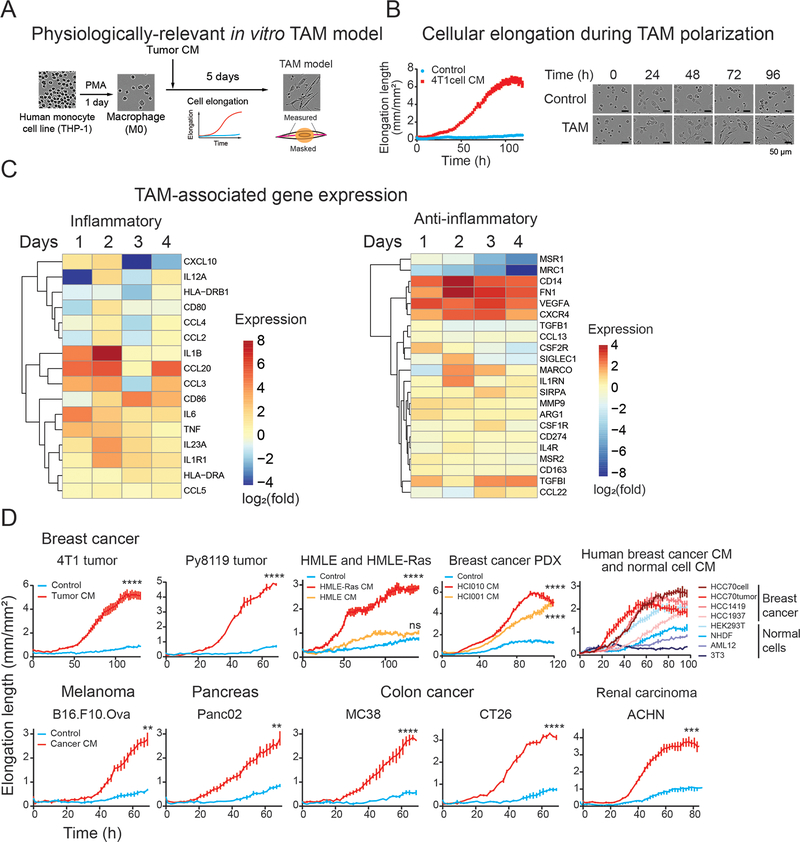
Figure 1. Establishment and characterization of an in vitro TAM polarization model.
(A) A schematic showing establishment of an in vitro TAM polarization model. Human monocyte THP-1 cells were induced by phorbol 12-myristate 13-acetate (PMA) to differentiate into macrophages, followed by culturing in the presence of tumor conditioned medium (CM). Cellular polarization was assessed by cellular elongation measurement via live-cell imaging, as depicted in the illustration.
(B) Morphological alteration during TAM polarization in culture. THP-1-derived macrophages were incubated with CM collected from 4T1 cells. Live-cell images were captured every 2 hours under a live cell imaging microscope. The cellular protrusion length per image was measured using image analysis software.
(C) Gene expression of in vitro TAM model. THP-1 cells were polarized using CM from 4T1 tumor and collected at the indicated time. The expression of TAM-related genes was analyzed by qPCR. Data are presented as the log2 fold change of expression of CM-treated cells over control cells for each day.
(D) Validation of CM from multiple tumor models for cellular elongation of THP-1-derived macrophages. (Top) Validation in other breast cancer models. THP-1-derived macrophages were cultured with CM collected from 4T1 tumors, Py8119 tumors, human mammary epithelial cell line and its derivative cancerous cells generated by introducing Ras oncogene, (HMLE and HMLE-Ras), TNBC PDX tumors (HCI010 and HCI001), human breast cancer cell lines (HCC70, HCC1419, HCC1937), HCC70 tumors, and non-cancerous cell lines; human embryonic kidney cells (HEK293T), human primary fibroblasts (NHDF), mouse hepatocytes (AML12), and mouse fibroblasts (3T3). (Bottom) TAM polarization by CM from other cancer types. CMs from mouse melanoma (B16.F10.Ova), pancreatic cancer (Panc02), colon carcinoma (MC38 and CT26), and human renal carcinoma (ACHN) were used to induce THP-1-derived macrophages. Cellular elongation was measured under live-cell imaging system. The graphs indicate mean ± SEM of measurement at each time point. **p<0.01, ***p<0.001, **** p<0.0001, Student’s t-test (2 groups) or One-way ANOVA with Dunnett’s multiple comparison test (3 groups) at the endpoint.

