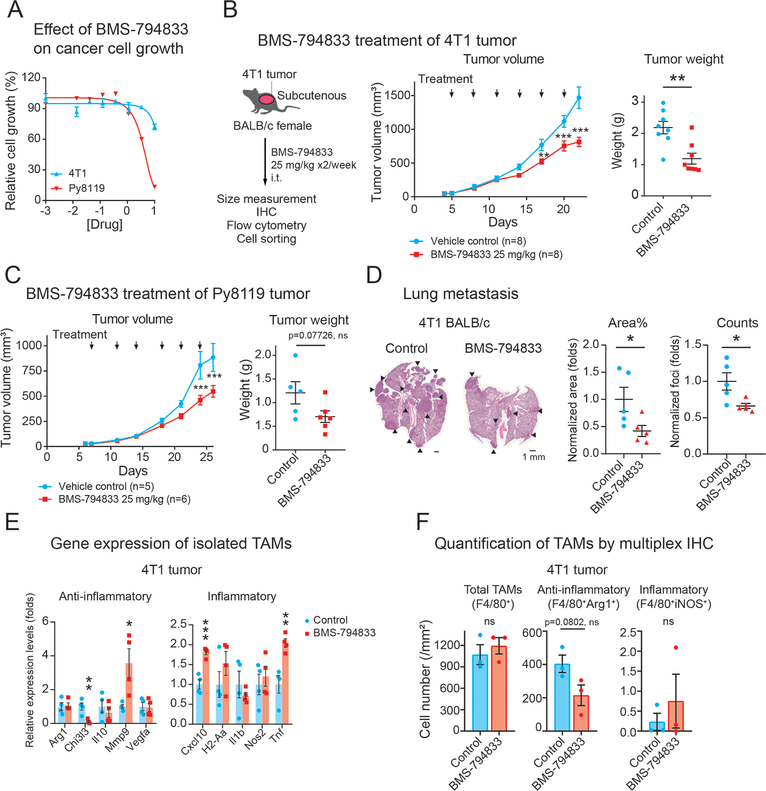
Figure 4. BMS-794833 treatment suppressed breast tumor growth.
(A) Effect of BMS-794833 on the proliferation of TNBC cell lines, 4T1 and Py8119 cultured in a plate. 4T1-nucGFP or Py8119 were cultured under the presence of a serial dose of BMS-794833. Cell proliferation of 4T1 was evaluated by nuclear GFP count, and of Py8119 by cell confluency. N=3, with mean ± SEM.
(B) Tumor growth of 4T1 tumors treated with BMS-794833. (Left) A schematic of experimental design. BALB/c female mice with subcutaneous 4T1 tumor were treated biweekly with either BMS-794833 (25 mg/kg) or vehicle control with intratumoral injections. (Middle) Growth curves of 4T1 tumors. The timing of drug administration is indicated with black arrows. n=8. (Right) Tumor weight at the experimental endpoint. Mean ± SEM.
(C) Tumor growth of Py8119 tumors treated with BMS-794833. (Left) Growth curves of Py8119 tumors. CB57BL/6J female mice with subcutaneous Py8119 tumor were treated biweekly with either BMS-794833 (25 mg/kg) or vehicle control with intratumoral injections. The timing of drug administrations is indicated with black arrows. n=5 (control), n=6 (treatment). (Right) Tumor weight at the experimental endpoint. Mean ± SEM.
(D) (Left) Representative images of H&E staining of lung sections from BMS-794833-treated or vehicle-treated 4T1 tumor-bearing mice. Black arrows indicate metastatic tumors. (Middle) Normalized percentage of the tumor area and (right) the normalized number of metastatic foci in the lung sections. The lines indicate the mean ± SEM.
(E) Gene expression of TAMs (CD45+CD11b+Ly6C−Ly6G−F4/80+) isolated from 4T1 tumor treated with BMS-794833. Expression of inflammatory and anti-inflammatory genes in the sorted TAM population (the gate is shown in Figures S2E, F) was measured by qPCR.
(F) Quantification of inflammatory and anti-inflammatory TAMs by fluorescent multiplex IHC. Total and subtypes of TAMs in the representative 4T1 tumors with or without BMS-794833 treatment from Figure 4B were quantified by multiplex IHC using antibodies against F4/80, Arg1, and iNOS. Cells were counted based on nuclear segmentation and were normalized to the analyzed surface area. The graph represents mean ± SEM with individual data points. *p<0.05, **p<0.01, **p<0.001, multiple t-test at each timepoint with Holm-Sidak correction (α<0.05) for tumor growth of (B) and (C), unpaired two-tailed Student’s t-test ((B, right), (C, right), (D, right), (E), (F)).

