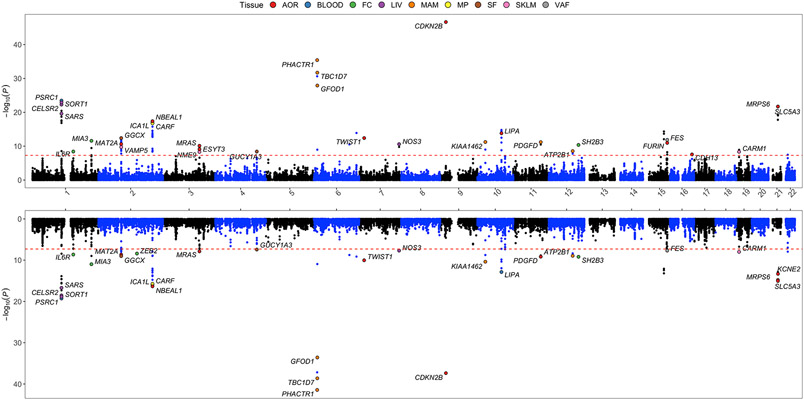
Figure 2. Manhattan plot of IGA and MetaXcan results demonstrating tissue-specific gene expression associated with CAD genetic risk loci.
Upper panel, candidate CAD causal genes identified by integrating STARNET eQTLs (9 tissue/cell types) and UKBB GWAS data.1 Y axis denotes −log10(MetaXcan P value). Only genes with a MetaXcan P value < 5x10⁻⁸ (dashed red line) are shown. The tissue where the most significant MetaXcan P value was observed is color coded. Lower panel, candidate CAD causal genes identified using the same IGA pipeline by integrating STARNET eQTLs and CARDIoGRAMplusC4D CAD GWAS.

