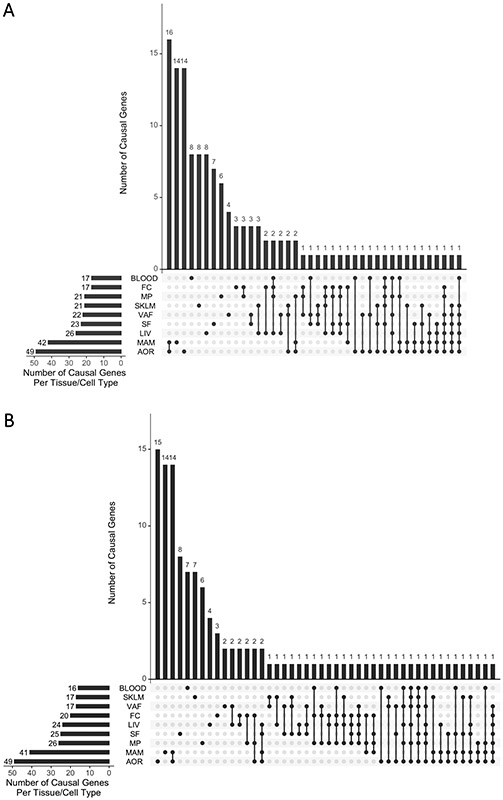
Figure 3. Summary of IGA and MetaXcan results.

(A) MetaXcan results based on UKBB GWAS data. The X axis shows different tissue/cell types, and combinations of these different tissue/cell types, from among the 9 tissue/cell types sampled in STARNET. The Y axis shows the number of genes identified by MetaXcan for that combination of tissue/cell types. (B) As per (A), showing MetaXcan results based on CARDIoGRAMplusC4D GWAS data.
