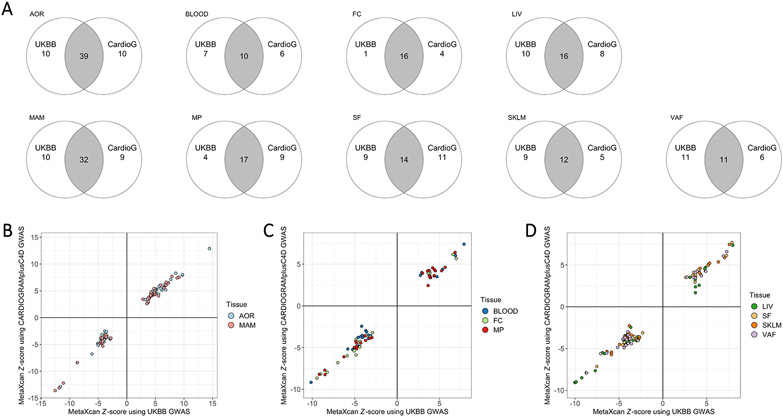
Figure 4. Concordance of IGA using STARNET with alternate GWAS datasets.
(A) Venn diagrams showing the number of candidate causal CAD genes, for each tissue/cell type in STARNET, identified in an IGA using STARNET with either UKBB or CARDIoGRAMplusC4D (CardioG). (B) x-y plots of Z-score results generated using MetaXcan alone for UKBB versus CARDIoGRAMplusC4D GWAS data when integrated with STARNET eQTL data for AOR and MAM. (C) x-y plot as per (B) but using STARNET eQTL data for BLOOD, FC and MP. (D) x-y plot as per (B) but using STARNET eQTL data for LIV, SF, SKLM and VAF.

