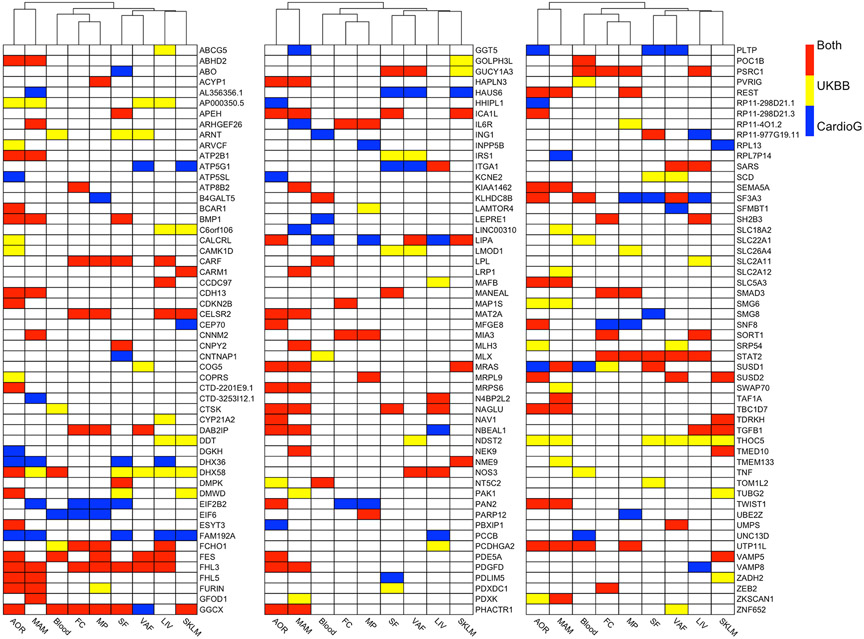
Figure 5. Heatmap showing 162 candidate causal CAD genes and the tissue(s) in which they exert their causal effect.
Candidate causal genes are shown for the IGA performed using STARNET with UKBB or CARDIoGRAMplusC4D GWASs. Genes are listed alphabetically, and tissue/cell types have been clustered. This is a visual summary of the genes listed in Supplemental Table VII, but also indicates all tissues in which these genes exert their causal effect (Supplemental Tables V and VI).

