
Figure 6: Reuterin induces protein oxidation and inhibits ribosomal biogenesis.
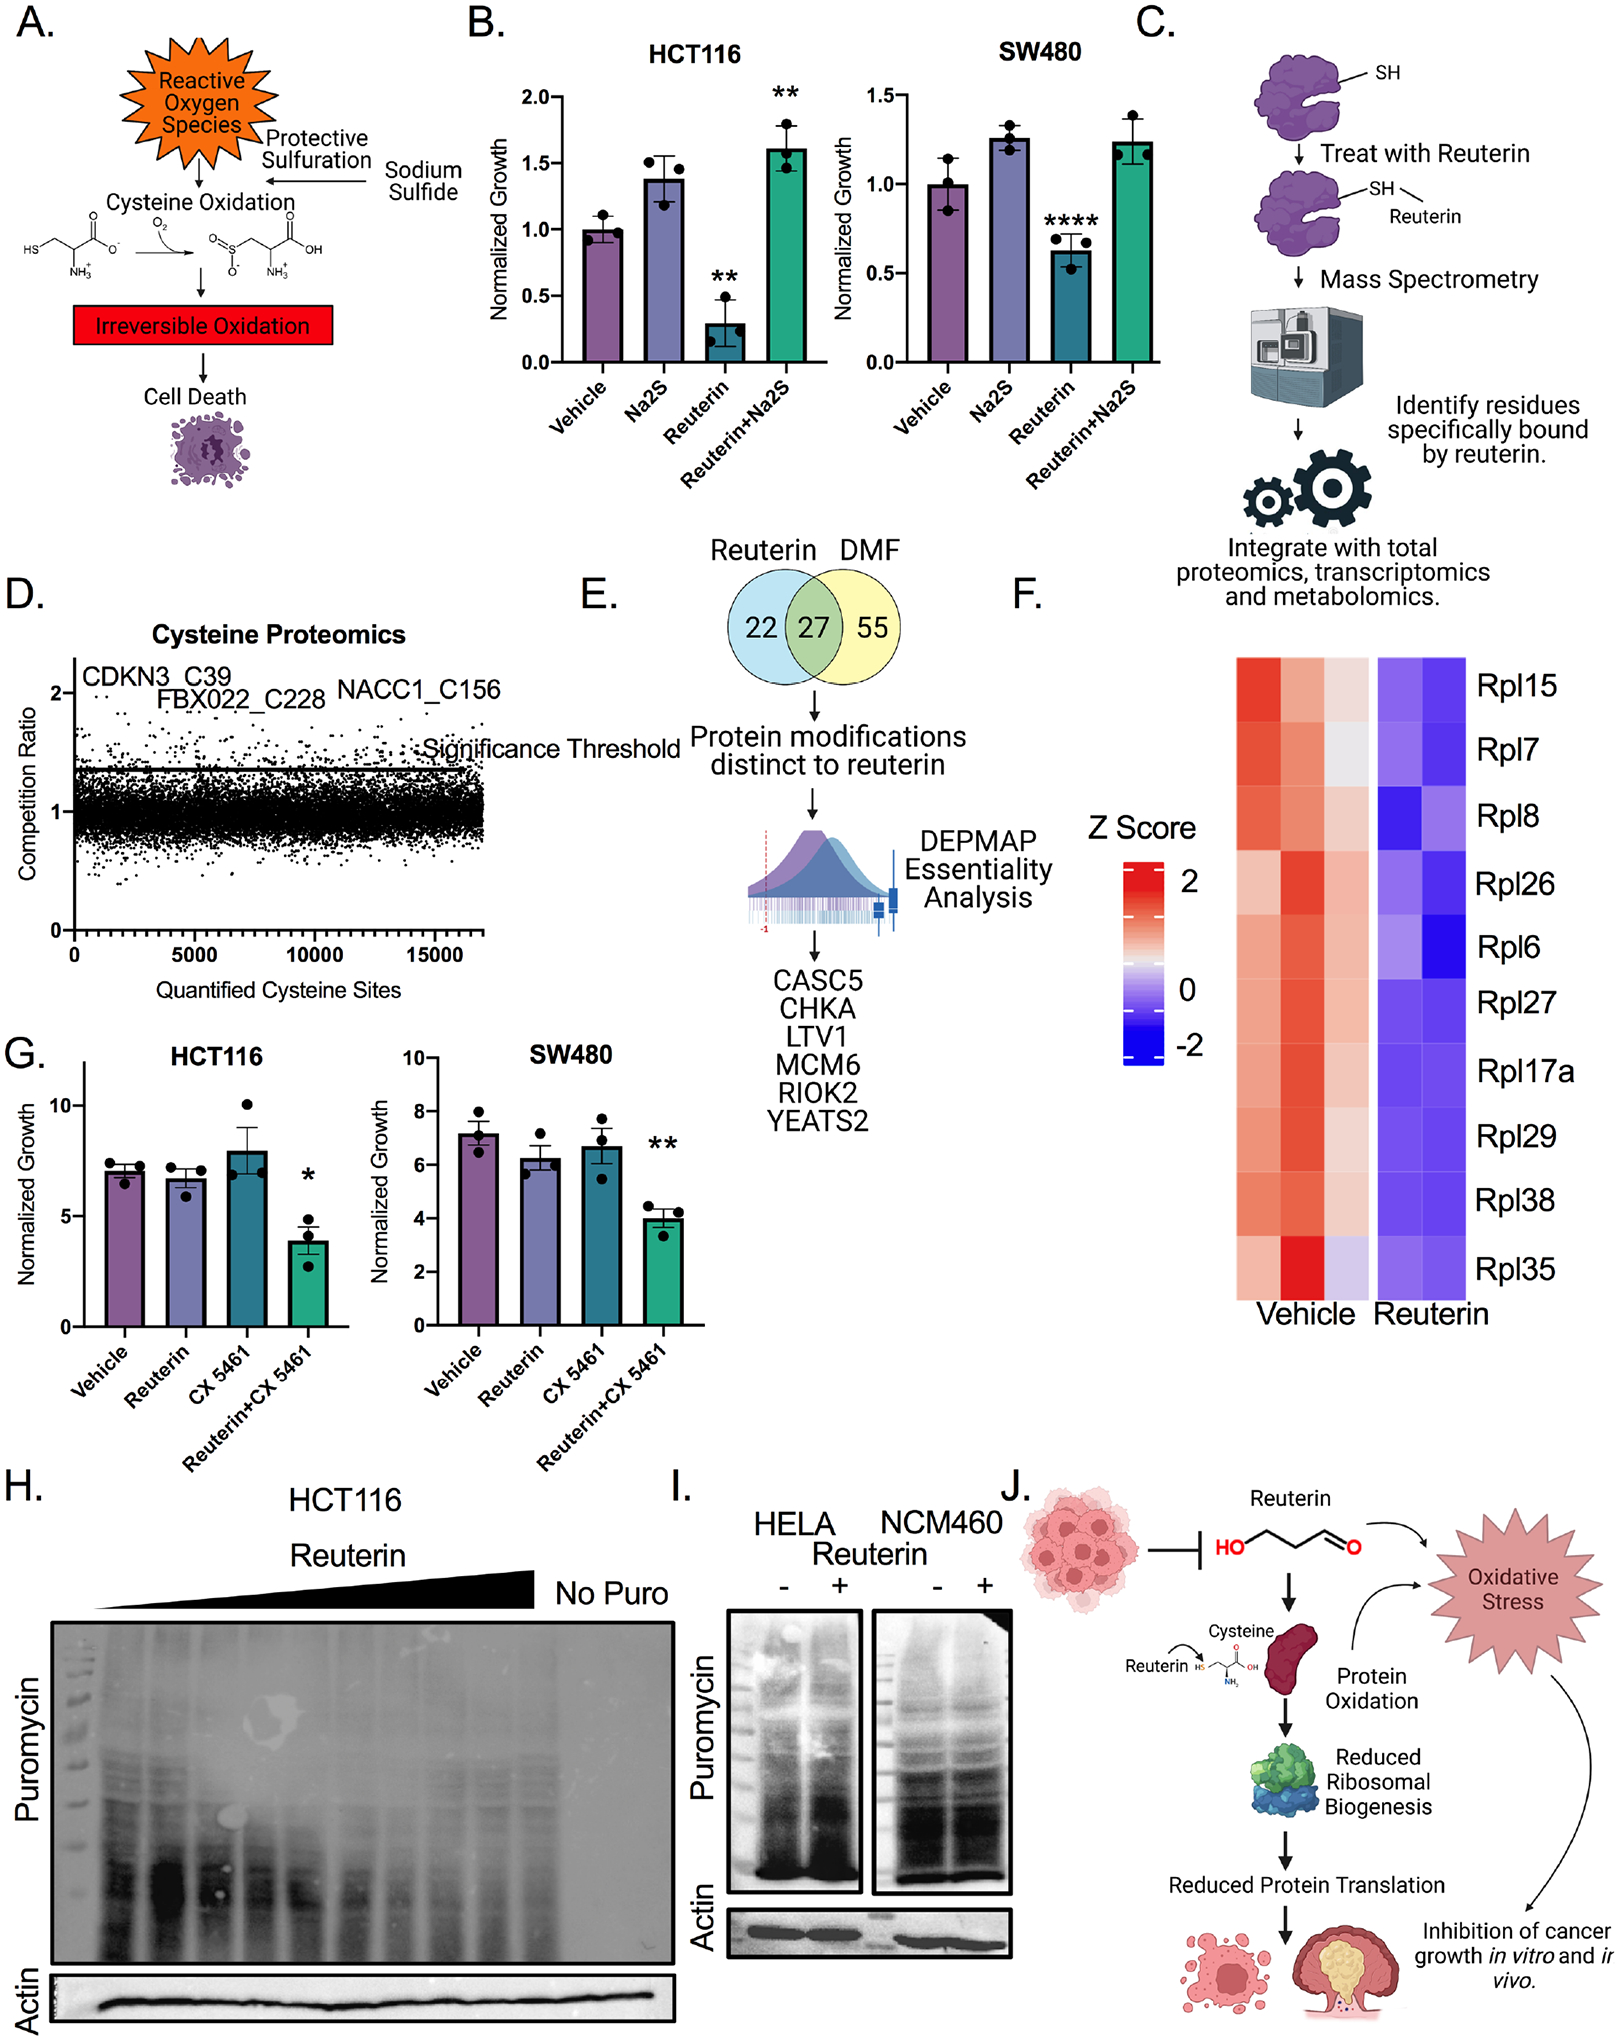
A) Schematic of protective persulfidation from protein oxidation. B). Cells were pretreated with 50μm reuterin for 12 hours, then media was washed out, and cells were treated with 200μm sodium sulfide for 24 hours before LDH assay. (n=3). C) Schematic for integrated proteomics, transcriptomics and metabolomics. D) Competition ratio of average of three separate samples for cysteine sites bound by reuterin. (n=3, repeated twice). E) Analysis of cysteine proteomics data with DepMap. F) Heat map of YEATS2 target genes in cells treated with reuterin. (n=5). G) Growth assays of cells co-treated with 2μm of CX5461 and 10μm of reuterin for 72 hours. (n=3). H) Puromycin western blot of cells treated with doses increasing from 1 to 150μm reuterin for 24 hours. I) Puromycin western blot of cells treated with 100μm reuterin for 24 hours. J) Schematic of proposed mechanism of action for reuterin. Statistics were calculated with one-way ANOVA (Panels B and G). *p < 0.05, ** p < 0.01, *** p < 0.001, **** p < 0.0001. Data is presented as mean +/− the standard error of the mean. Cysteine proteomics was performed in triplicate two times, RNA-SEQ experiment was performed in triplicate once. All other experiments were performed in triplicates at least three times.