
Figure 7: Reuterin inhibits colorectal cancer growth in vivo.
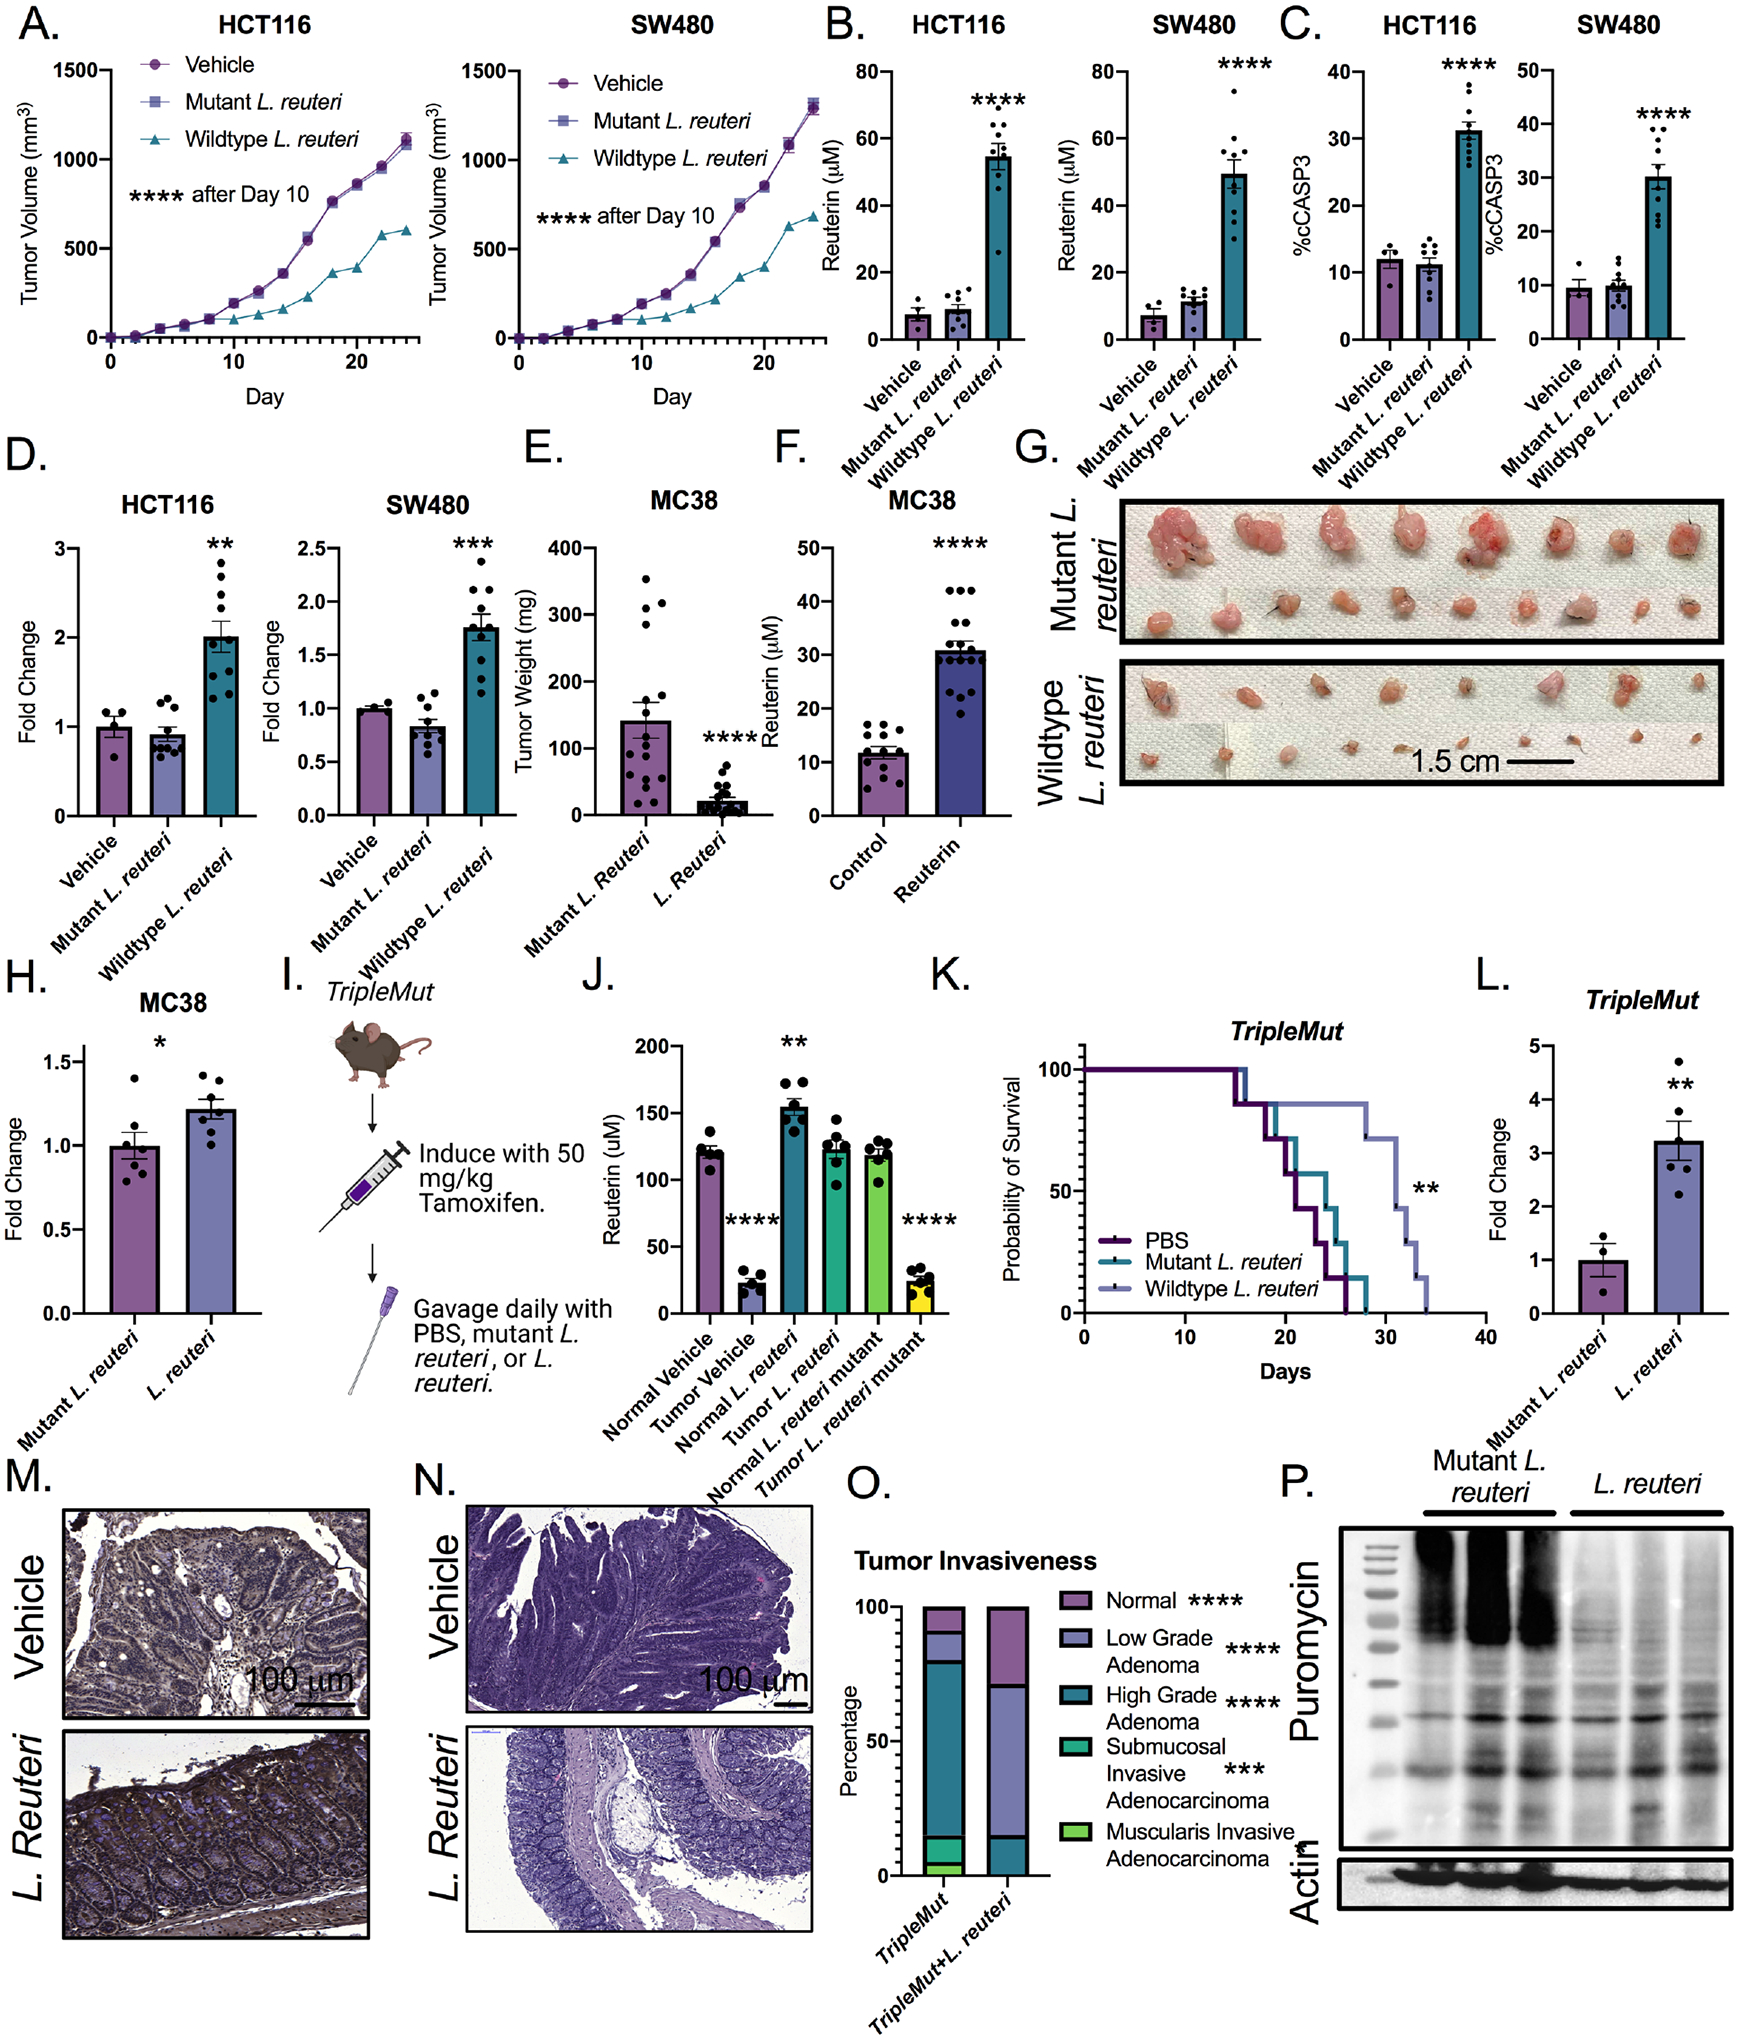
A) Quantification of tumor size of implanted HCT116 and SW480 cells in nude mice followed by daily gavage with wildtype or mutant L. reuteri or PBS (n=4–10). B) Quantification of reuterin in tumor from panel A. C) Percent cleaved caspase 3 cells (cCASP3) in tumors from panel A. D) Fold change of DCFDA ROS signal in tumors from panel A. E) End point weight of tumors of MC38 in mice gavaged daily with L. reuteri (n=8–9). F) Quantification of reuterin in MC38 tumors from E. G) Picture of representative tumors from D. H) Fold change of DCFDA ROS measurements from MC38 tumors. I) Schematic for treatment of the TripleMut. J) Quantification of reuterin in whole colon from indicated treatment groups. (n=4–6). K) Survival curve of mice gavaged daily by either wild-type or mutant L. reuteri. (n=7). L) DCFDA ROS measurements from the colons of induced TripleMut mice treated with either mutant or wildtype L. reuteri.(n=3–6). M) Representative 4HNE immunohistochemistry in induced TripleMut mice. (n=3–6, representative shown). N) H and E of PBS treated or L. reuteri treated TripleMut mice. (n=3–6, representative shown). O). Pathological score of TripleMut mice treated with wild-type or mutant L. reuteri. (n=4–5). P) Puromycin western blot of induced TripleMut mice sacrificed on Day 10 and treated with daily gavage of either wild-type or mutant L. reuteri. Colons were washed, homogenized, and stained with puromycin ex vivo for thirty minutes. (n=3–6, representative shown). Statistics were calculated with one-way ANOVA (Panels A, B, C, D, J, K, and O) or t-test (panels E, F, H and L). *p < 0.05, ** p < 0.01, *** p < 0.001, **** p < 0.0001. Data is presented as mean +/− the standard error of the mean. Xenograft experiments were performed once. MC38 syngeneic experiments were performed two times with the indicated mouse numbers.