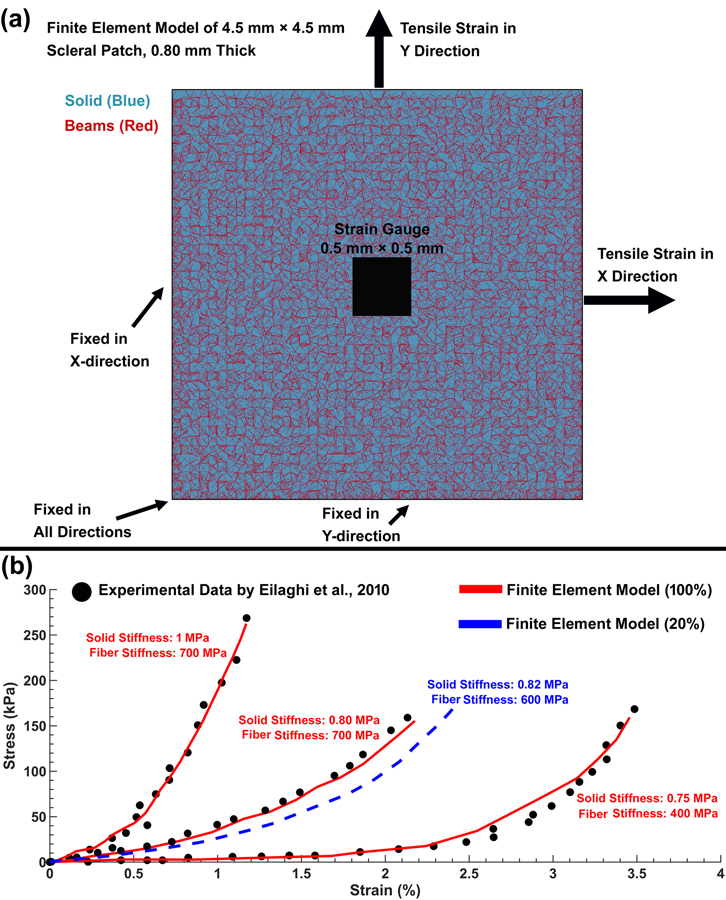
Fig. 5.
(a) FE model of the scleral patch, including the strain gauge and boundary conditions. (b) Stress-strain curves representing the stiffest, most compliant, and average responses [39] from experimental biaxial tensile testing of human sclera patches (black dots), compared to identical FE cable-in-solid models of a planar isotropic scleral patch (red solid and blue dashed lines). The red line represents the fiber density of 100% used to represent the heterogeneous, anisotropic collagen fibers in the peripapillary sclera in our posterior eye FE model, and the blue dashed line represents the fiber density of 20% that represents the planar isotropic collagen fibers of the peripheral sclera and pia.

