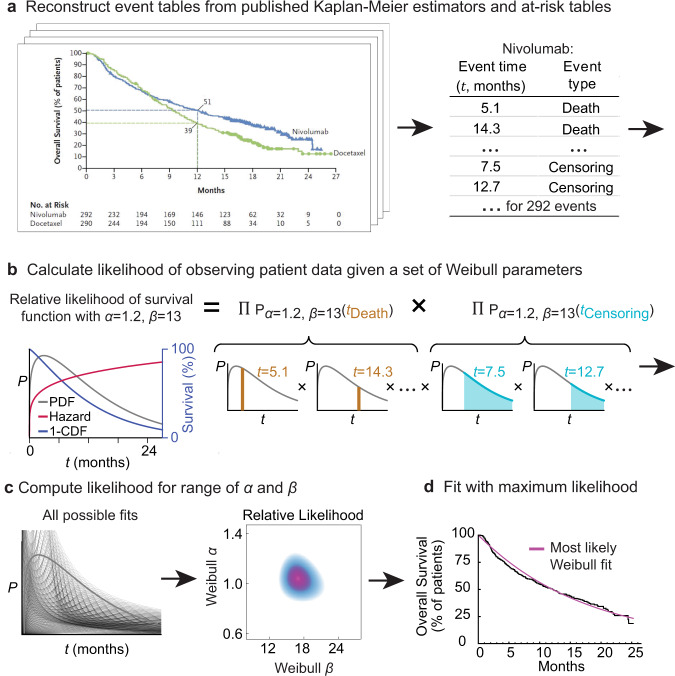
Fig. 1. Procedure for parameterizing survival curves starting with published figures.
a Kaplan–Meier survival curve and at-risk table obtained from clinical trial publication. Individual participant data (IPD) were imputed from digitized survival curves and at-risk tables as previously described (see “Methods”). b Each set of parameters corresponds to a different probability density function (PDF) and survival function (which corresponds to 1 minus the cumulative density function (CDF)). The likelihood of observing actual data is then computed. c Likelihood calculation is repeated for a set of possible parameter values. d The most likely (best) fit is obtained by finding the parameter values with the maximum likelihood.

