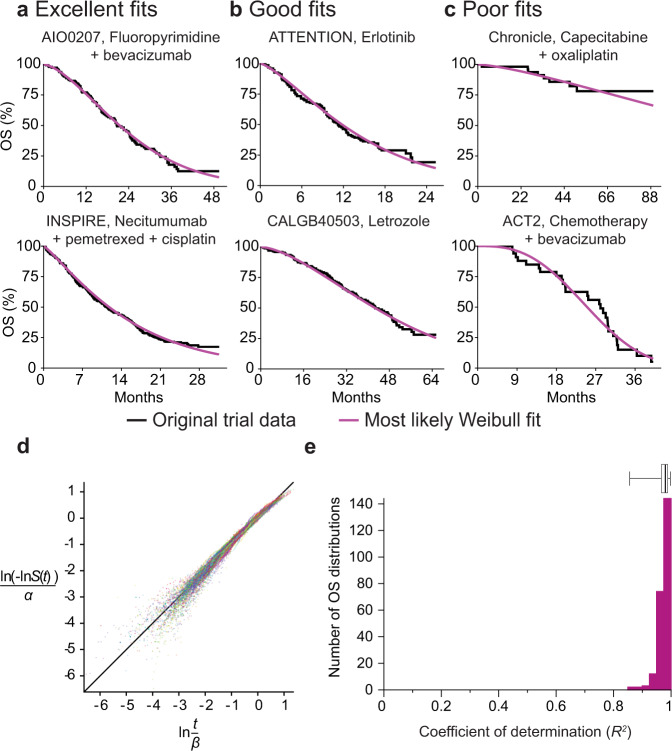
Fig. 2. Representative fits of Weibull distributions to overall survival (OS) trial data.
a Weibull fits to data for plots of the Kaplan–Meier estimator falling in the top 25th percentile quality of all fits (NCT00973609, NCT00982111) b between the first and third quartile (NCT01377376, NCT00601900) and c in the lower quartile (NCT00427713, NCT01229813). d Weibull plot for patient events in all OS trials (for 237 trial arms from 116 publication figures). This is a transformation of survival data that is linear if the data follow a Weibull distribution. e Goodness of fit as the coefficient of determination (R2) explained by fitted Weibull functions for all trial arms reporting OS data (n = 237 trial arms). Boxplot center line indicates median; box limits indicate the upper and lower quartile values; whiskers span the full data set.

