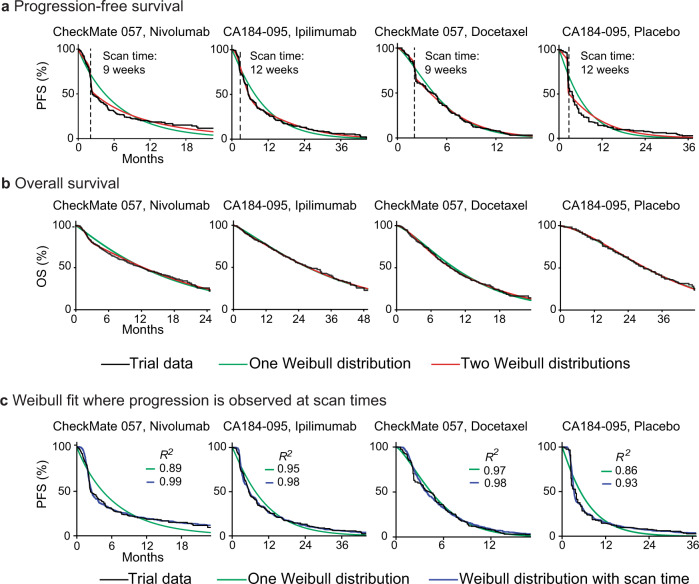
Fig. 3. Fit of Weibull models to progression-free survival and overall survival data for trials of immune checkpoint inhibitors.
a PFS distributions and b OS distributions for individual arms of two trials of immune checkpoint inhibitors (NCT01673867, NCT01057810) with fit to either one or two Weibull distributions. PFS data are best described by using a mixture model of two Weibull distributions, each with two parameters. OS distributions are described equivalently well by a one or two-distribution fit. c PFS simulations that account for the periodicity of radiological scans to detect progression improve the quality of one-distribution Weibull fits, as quantified by the coefficient of determination (R2).

