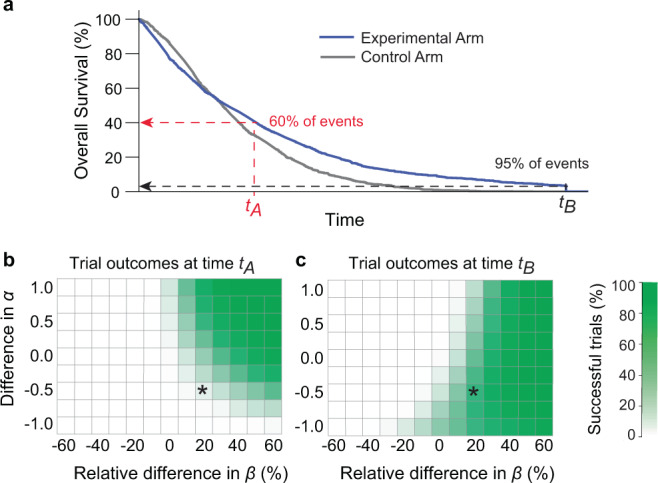
Fig. 7. Effect of trial duration on success when proportional hazards are violated.

a One of many simulated trials having a range of Weibull α and β parameters similar to those observed in actual trials reporting OS data; in this trial, Δα = −0.5 and the ratio of β for experimental and control arms was 1.2. The labels tA and tB denote times corresponding to approximately 60% or 95% of all trial events (for real OS trial arms in this article, in metastatic cancers, these event rates correspond to median times of tA = 22 months and tB = 50 months). b Percent of simulated successful trials at time tA or c tB. The simulated trial depicted in panel a is denoted by an asterisk. “Success” was scored as a hazard ratio less than one at a 95% confidence level using the Cox proportional hazards regression; this metric was used despite the violation of proportional hazards because it is the accepted approach for assessing efficacy in pivotal trials (see text and “Methods” for details).
