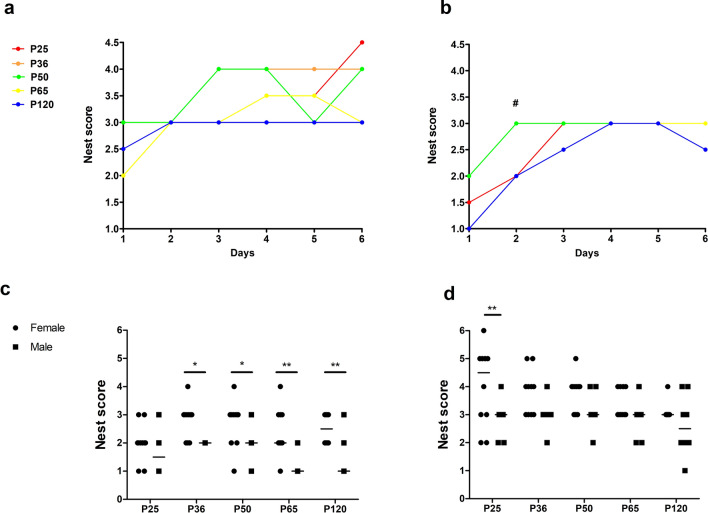
Figure 2.
Nest building performance and nest complexity. The development of nest complexity scores differed between age phases in (a) female animals (F(4, 290) = 2.75991, p = 0.02804), but not in (b) male animals (F(4, 290) = 1.07471, p = 0.3692). In male animals, the nest scores in P50 animals exceeded that of P120 animals on the second day (b, #) (F(4, 45) = 2.885, p = 0.0329). Sex differences were evident (c) on the first day in all age groups except for P25 animals (interaction p = 0.3161, age phase p = 0.0205, sex p < 0.0001). In contrast, sex differences in P25 mice became evident (d) only on the last day (interaction p = 0.6905, age phase p = 0.0504, sex p < 0.0001). Linear regression for (a) and (b); one-way ANOVA, followed by Bonferroni multiple comparison tests for #; two-way ANOVA followed by Bonferroni multiple comparison tests for (c) and (d), *p < 0.05, median. Colored dots/lines refer to the respective age groups.

