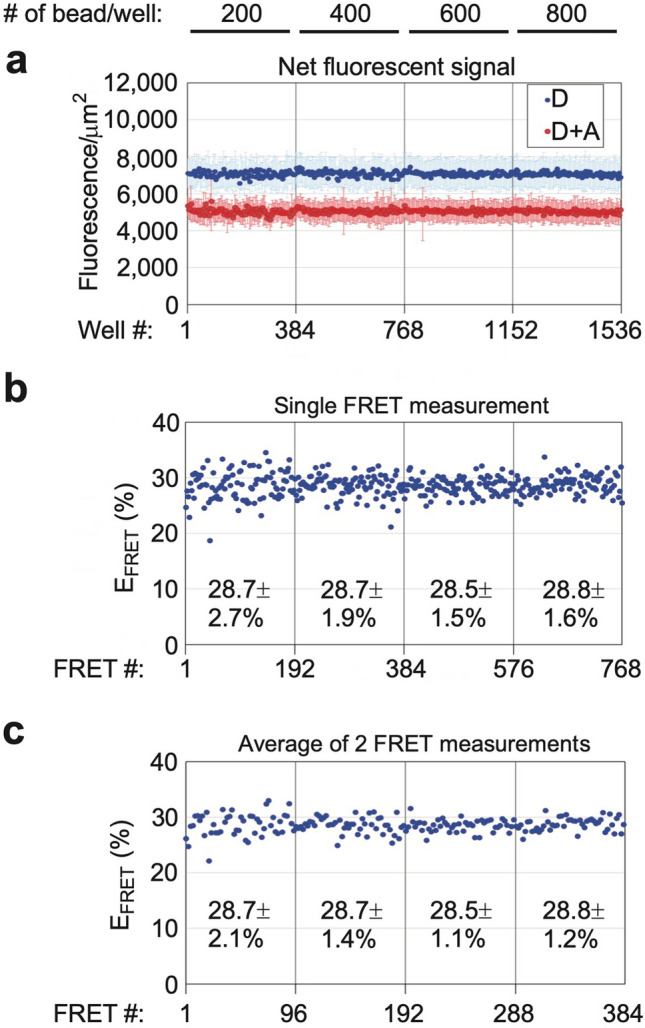
Figure 5.

Bead titration in 1,536-well format. (a) Individual dots show mean fluorescence intensity ± SD for D and D + A samples bound to 17 µm beads in matched paired wells of a 1,536-well plate. Number of beads in each well is indicated at top. (1-image/well = 19% of total well area). (b & c) Individual EFRET values calculated from single D and D + A pair of wells (b), or average of two D and D + A pairs (c). Mean EFRET ± SD values were calculated for each bead binding condition (n = 192 single D and D + A pair or 96 average of two D and D + A pairs in panels b or c, respectively).
