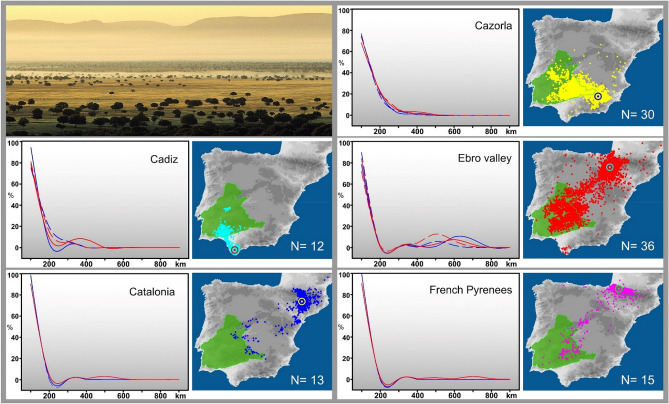
Figure 1.
Study populations and areas. Above left: “dehesa” landscape in central Iberia (Cabañeros National park) (Photo: V. García-Canseco). We show a panel for each study population with both a map of the daily locations and the splined distribution of their distances to the nest or activity center. Continuous and discontinuous lines represent males and females respectively (Winter in blue, summer in red). The mean position of nests/activity centers for each population is shown by a circle. The distribution of the “dehesas” in the Iberian Peninsula is shown in green (depicted from CORINE land Cover). Maps were generated using QGIS 3.6.0 Noosa (https://www.qgis.org/es/site/)90.

